uPLT and Gaze User Study Results
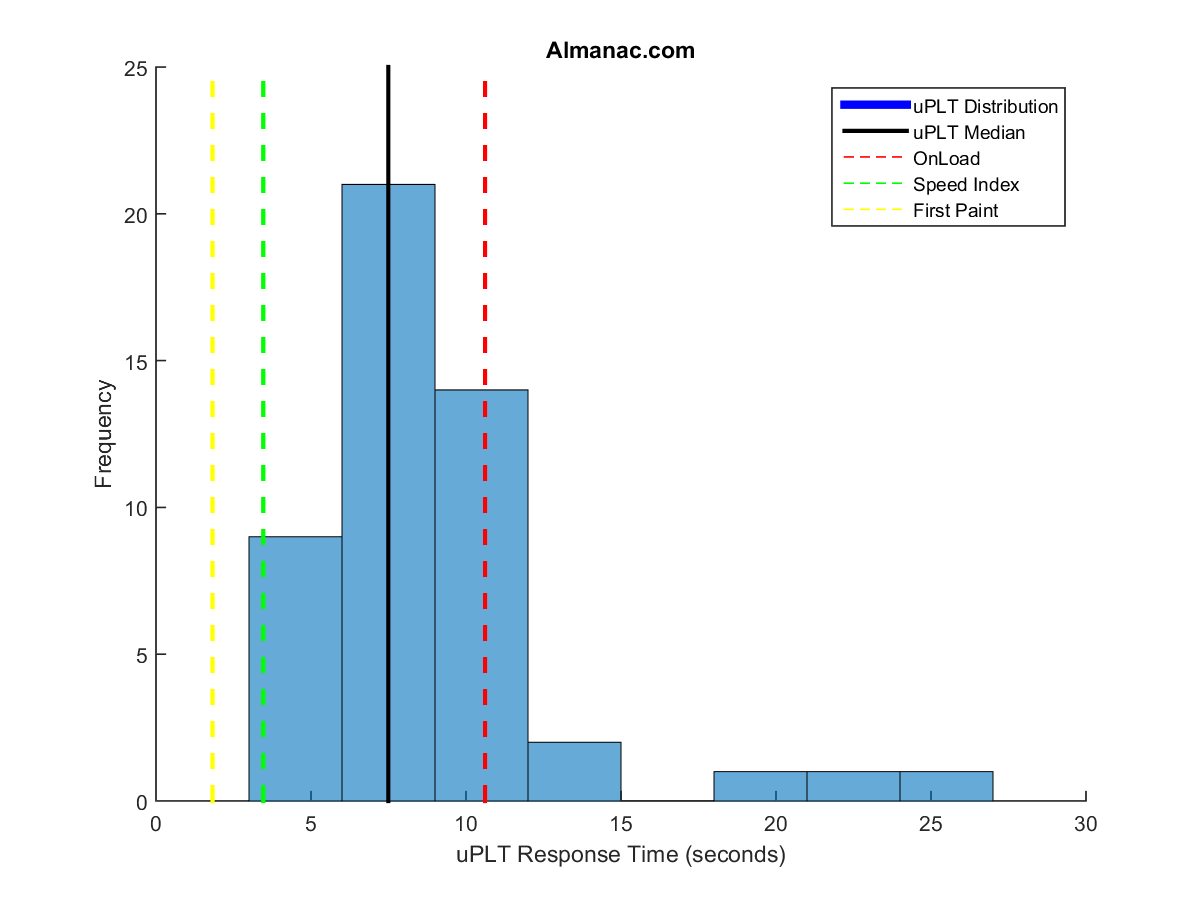
Traditional Metrics and uPLT
Gaze Tracks
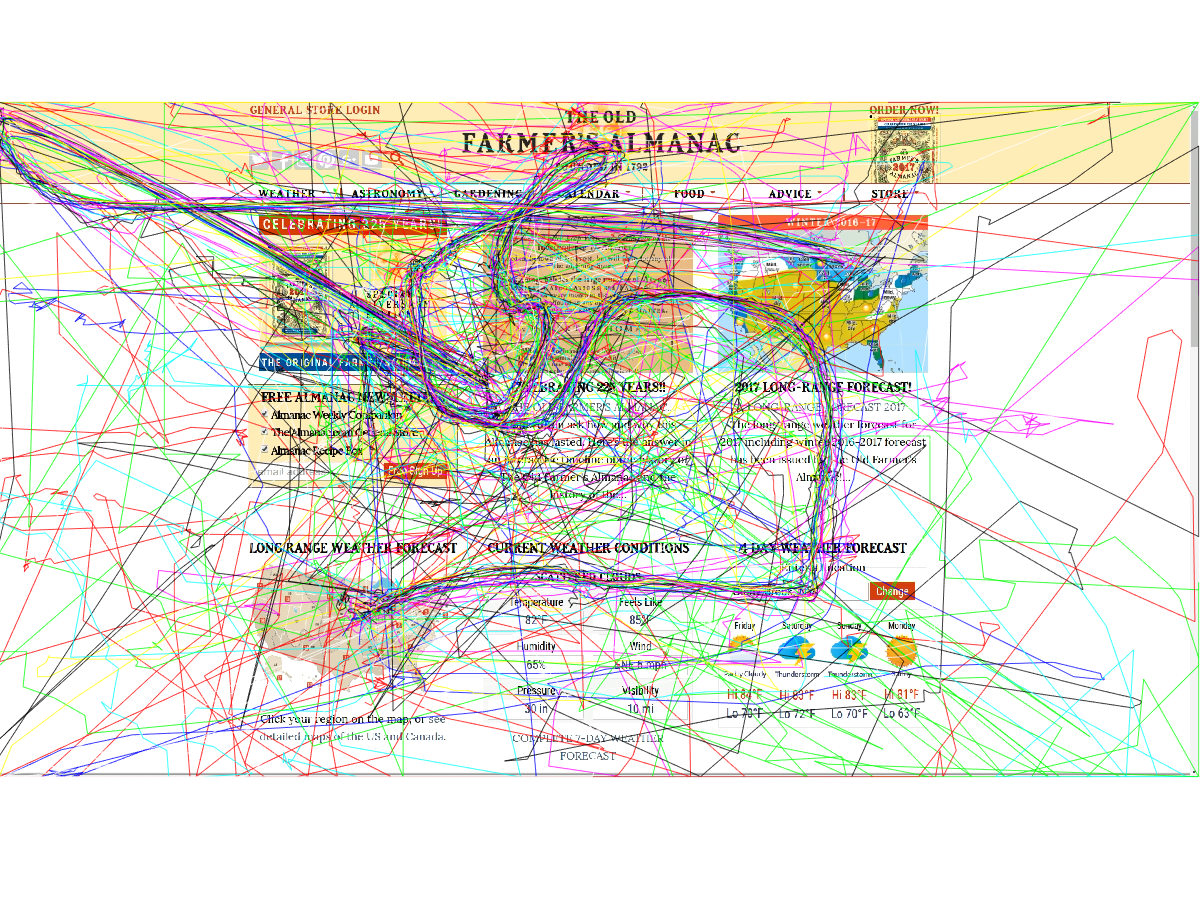
Visual Regions

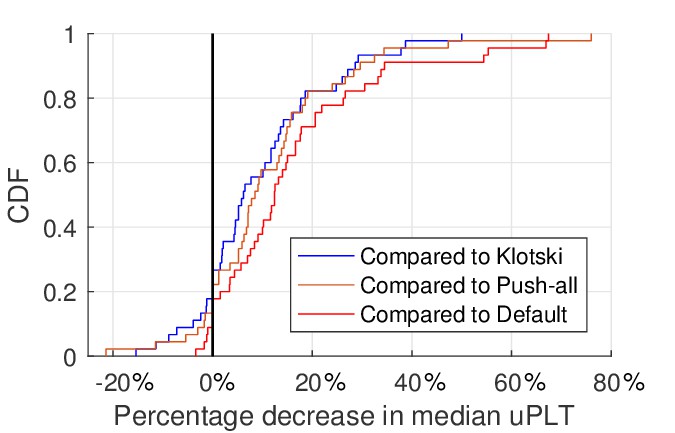
WebGaze Performance Comparison
Video Demo
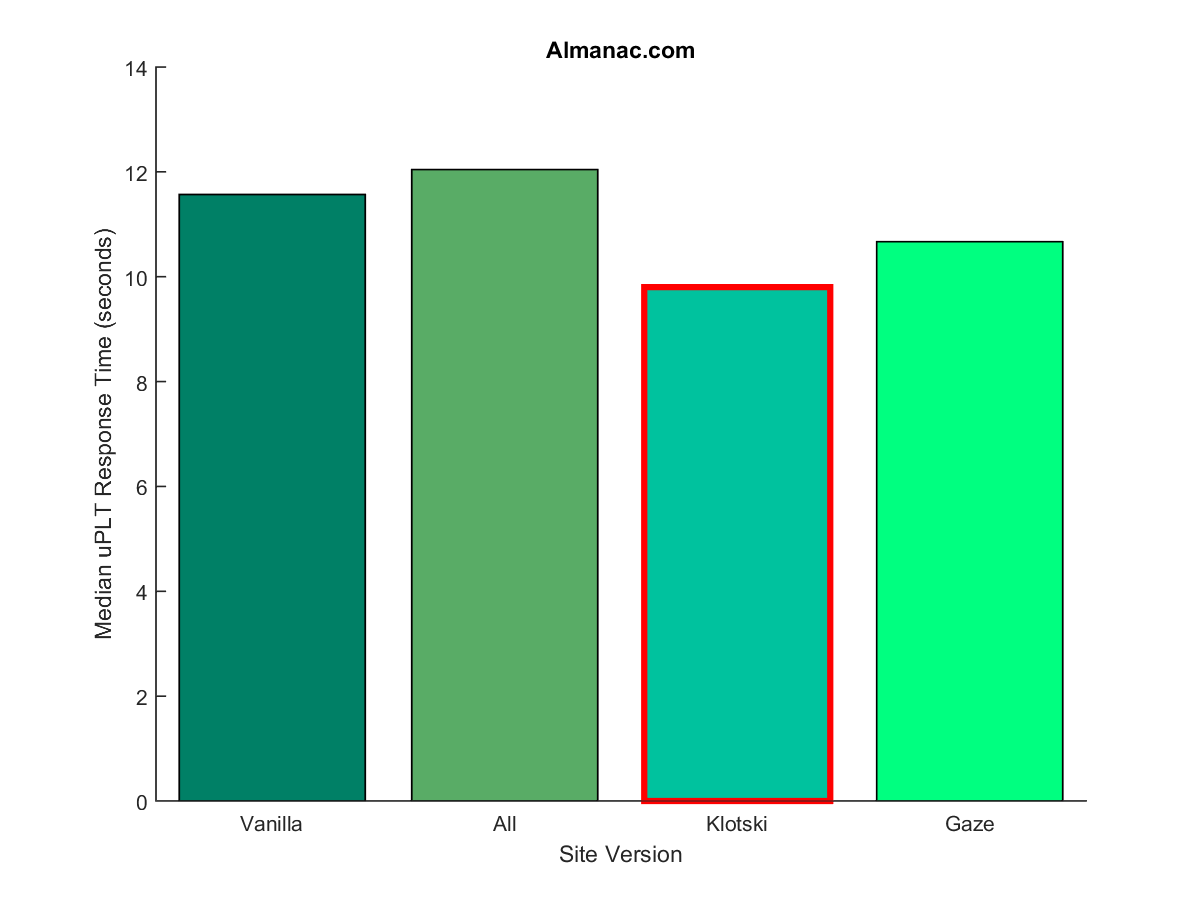
Result uPLT Medians
Overall Comparison
About Data and Visualization
This page contains visualizations of (1) the user-perceived Page Load Time (uPLT) and eye gaze collected from the user studies, and (2) comparisons of our WebGaze system with the baseline and the state-of-the-art techniques.
Top: (1) Spread of uPLT values obtained from users compared to traditional PLT metrics, (2) Gaze tracks of users, (3) Visual regions of the Web page considered for measuring fixations. Notice how the gaze tracks of "all" users have significant overlap, as evidenced by the thick lines.
Bottom: (1) Video of the side-by-side loads of a site under WebGaze and alternate techniques and (2) graphs showing the median uPLT values from the user study.
All data used to make these figures and the figures in the paper are publicly available through the download links below in .zip format.
Please see the enclosed README.txt in each zip for details on utilizing the data.
Almanac.com
Almanac.com
Almanac.com
Almanac.com
Overall Comparison CDF