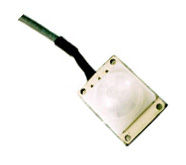
Motion
Light
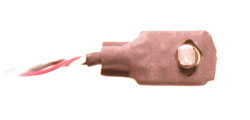
Touch
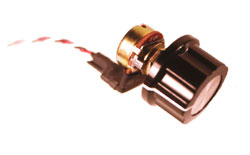

Potentiometer
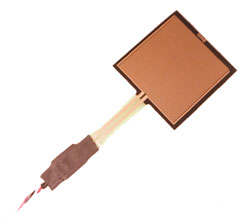
Flex
Temperature
All sensors are transducers. A transducer is a device that converts energy from some physical parameter into corresponding electrical signals. Sensors are input transducers (like a microphone). Actuators (sometimes called effectors) are output transducers (like speakers).
Some sensors are strictly electrical like thermocouples, and have no moving parts. Other sensors are electromechanical and translate motion into an electrical signal. (A tipping bucket rain gauge is an example of this type.) Electro-chemical sensors, such as pH probes, monitor changing chemical concentrations.
Some sensors produce a continuously varying voltage signal, while others produce only discrete voltages.
Devices that sense more complex parameters and manipulate the raw data prior to generating an output can be classified in the general category of instrumentation. Mass Spectrometers and gas chromatographs are examples of instrumentation. There is a primary sensor in every piece of instrumentation (such as the photomultiplier tube in a spectrometer), but its signal is processed and conditioned before being output from the instrument.
With only a few exceptions, sensors and instrumentation have electrical outputs that vary in either voltage, resistance or current. Some sensors, like photogates, motion detectors, and radiation monitors can have digital output.
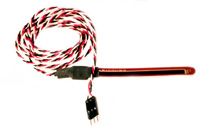
Various types of sensors:
|
|
|
Motion |
Light |
Touch |
|
|
|
Potentiometer |
Flex |
Temperature |
Sensors from Infusion Systems for the I-CubeX interface.
Analog to digital conversion - microcontrollers and interfaces
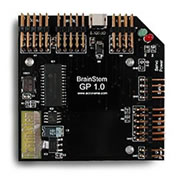
Sensor output must be converted from an electrical (analog) signal to a digital one. This task is usually handled by a microcontroller or a more elaborate interface. Microcontrollers are small and inexpensive, like the Brainstem, but require additional hardware (like a serial to USB converter) in order to bring the data into the computer. The Brainstem ships with a programming interface so that the microcontroller can function in stand-alone mode onboard a robot. This is called embedded mode. In slave mode the microcontroller merely feeds sensor data into the computer. The Brainstem has 5 analog inputs and 4 servo outputs.
More expensive interfaces, like the Vernier LabPro, have outputs to serial, USB, and even graphing calculators. Like many of these more elaborate interfaces the Vernier ships with datalogging software. The LabPro has 4 analog data collection channels.
The I-CubeX interface converts the analog sensor output to MIDI. A MIDI to USB converter is needed to bring the data into computers that don't have a MIDI interface. The I-CubeX has 24 inputs for sensors and 8 outputs for actuators.
 |
 |
 |
Acroname Brainstem (serial) |
Vernier LabPro (serial/USB) |
Infusion Systems I-CubeX (MIDI) |
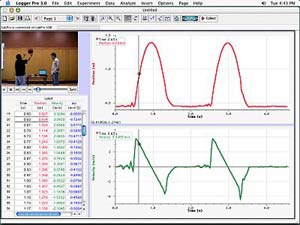
Screen capture from the Vernier Logger Pro 3 datalogger.
Scaling values
The stream of digital values that the analog voltage of the sensor is converted to depends on the microcontroller or interface. The Brainstem converts the analog signal to a range of values from 0 to 1023. The I-CubeX converts the analog signal to MIDI channel (1-16) and controller (0-127) information. To be useful this data must be scaled in relation to either display size, color pallete values, or some other value that will represent that data on the computer. For example, with the I-CubeX, multiplying the sensor values by 2 would result in values from 0 to 255, or the same values used to represent grayscale. Therefore a graphic on screen could change color from black to white (or any shade inbetween) in response to a change in sensor values. Input from 3 sensors could give you values for RGB color.
Actuators
Servo motors, LED's, and audio speakers are examples of actuators. Once the computer has processed the incoming sensor data it can be programmed to send instructions to a microcontroller or sensor interface to drive an effector based on the sensor data. In the case of the Brainstem, turning a robot in the direction of a moving object would be one example. In the case of the I-CubeX, sending MIDI messages to a synthesizer would be a typical scenario.
Static sensor characteristics
Accuracy
Discrimination
Precision
Errors
Drift
Sensitivity
Linearity
Hystheresis
Accuracy, discrimination and precision
Accuracy is the capacity of a measuring instrument to give
results close to the true value of the measured quantity
Accuracy is measured by the absolute and relative errors
Absolute Error = Result - True Value
Relative Error = Absolute Error/ True Value
Discrimination is the minimal change of the input necessary to produce a detectable
change at the output
Discrimination is also known as resoultion
When the increment is from zero, it is called threshold
Precision
The capacity of a measuring instrument to give the same reading when repetitively
measuring the same quantity under the same prescribed conditions
Precision implies agreement between successive readings, not closeness to
the true value
Precision is a necessary but not sufficient condition for accuracy
Two terms closely related to precision:
Repeatability
The precision of a set of measurements taken over a short time intervalReproducibility
The precision of a set of measurements but taken over a long time interval, or performed by different operators, or with different instruments, or in different laboratories
Accuracy and errors
Systematic errors
Result from a variety of factors
Interfering or modifying variables (i.e., temperature)
Drift (i.e., changes in chemical structure or mechanical stresses)
The measurement process changes the measurand (i.e., loading errors)
The transmission process changes the signal (i.e., attenuation)
Human observers (i.e., parallax errors)
Systematic errors can be corrected with compensation methods (i.e., feedback, filtering)
Random errors
Also called noise: a signal that carries no information
True random errors (white noise) follow a Gaussian distribution
Sources of randomness:
Environmental noise (i.e., background noise picked by a microphone)
Transmission noise (i.e., 60Hz hum)
Signal to noise ratio (SNR)
With knowledge of the signal characteristics it may be possible to interpret a signal with a low SNR (i.e., understanding speech in a loud environment)
More static characteristics
Input range
The maximum and minimum value of the physical variable that can be measured
(i.e., -40F/100F in a thermometer)
Output range can be defined similarly
Sensitivity
The slope of the calibration curve
An ideal sensor will have a large and constant sensitivity
Sensitivity-related errors: saturation and “dead-bands”
Linearity
The closeness of the calibration curve to a specified straight line (i.e.,
theoretical behavior)
Monotonicity
A monotonic curve is one in which the dependent variable always increases
or decreases as the independent variable increases
Hystheresis
The difference between two output values that correspond to the same input
depending on the trajectory followed by the sensor
Backslash: hystheresis caused by looseness in a mechanical joint
How a motion sensor works:
The three most common motion sensor types are optic (light), ultrasonic (sound) and resistive (electric). A motion sensor uses the optic and ultrasonic most often.
Ultrasonic sensors are devices that have a sort of speaker in them. The sound this "speaker" puts out is of a very high range frequency so it can't be heard. The sound creates vibrations through the air. The waves travel out until they hit something solid enough to bounce off. Some of these bouncing waves return to the sensor. The sensor picks up these waves with a transducer. The transducer creates a signal that the sensor can understand. The sensor's circuits time how long it took for the waves to go out and back. Variations in timing translate to motion, proximity, and velocity.
References:
Remote Measurement Systems
http://www.measure.com/
Ricardo Gutierrez-Osuna, Intelligent Sensor Systems, Wright State University
MadSci Network, Washington University