
When our team was first assigned the movie challenge we were very excited to get started with making our first predictions. Our approach to tackling these challenges was eventually split - we realized quickly that our challenges would require two separate approaches, and possibly focus on different sets of data. The Golden Globe Awards prediction requires a model to categorize, to decide whether or not a person will win an award. For the movie gross prediction, we need a model to make a prediction for how much a movie will make.
During the course of the semester we went through stages of initial background research, data gathering, then modeling. By far the most time consuming task for the project was gathering the data. We scraped websites such as IMDB.com for their information about movies, actors, actresses, directors, and screenwriters. In addition to IMDB we scraped other websites such as RottenTomatoes.com and BoxOfficeMojo.com. After getting the data, the next step is to clean the data and merge together the scraped information about the people and movies together into a database. After producing a master database we then produced output data to feed into the models and analyzed which models to use by comparing their relative performance on our testing datasets. We have two movie challenges:
Our first challenge is to predict the movie gross of movies released on Christmas Day. We specifically focused on predicting the movie's lifetime gross as well as how much the movie grossed on Christmas Day.
For our second challenge, we explored models to predict the Golden Globe Award nominees and winners for the 72nd Golden Globe Award ceremony taking place on January 11th, 2015. We focused our efforts to predict the outcome of the following categories: Best Actor, Best Actress, Best Director, and Best Screenplay.
Literature exists with regard to predicting the winners of the Academy Awards, but is sparse for any other film award. Predicting the outcome of the Golden Globes includes the unique challenge: the Golden Globes are the first awards of the season. Past literature for Academy Award prediction often factored in whether or not the film won other awards, such as the Golden Globes or Directors Guild Award. From the literature we reviewed on award prediction, a common modeling method is to utilize a logistic regression on data obtained from IMDB. Movie gross prediction literature typically used regression methods. Some literature combined a regression method with an additional model such as k-nearest neighbors. IMDB was also a common source for data, though more recent approaches include additional sources.
For our full literature review, please refer to our reports linked at the bottom of the page.
CSV dataset outputs and our complete database are available for download here. They represent data compiled from IMDB, BoxOfficeMojo and RottenTomatoes. Our index of actors, actresses, screenwriters, directors, and movies comes from IMDB database. BoxOfficeMojo and RottenTomatoes provided additional data, such as audience and critic ratings, the number of theaters that screened the movie. The awards data scraped from IMDB website for each movie includes several awards including the Golden Globes, Academy Awards, BAFTAS, Director's Guild Awards, Writer's Guild Awards, and People's Choice Awards among others. The awards for the actors, actresses, directors, and screen-writers are sorted by award and year earned.
Link for download here: Dataset
Data reconciliation is a problem because each website refers to a particular movie or actor differently. Our challenge was to match data correctly to each movie or person. An example of this problem would be the movie titled "Titanic". The title "Titanic" was in fact used for a movie made in 1996 as well as in 1997 (the 1997 "Titanic" was the one that featured Leonardo DiCaprio and Kate Winslet). By querying the sources by name, further reconcile the different movies by also comparing the year that the movie was released.
For Golden Globes Prediction, our data for people (actors, actresses, writers, directors) contains a combined 1.4 million actors, actresses, writers, and directors in our database. We reduced the number of movies by requiring the length of the movie to be greater than 70 minutes (based on the Academy Award definition of a feature length movie), and with data that shows either the budget or gross being greater than $100,000. We made the elimination based on gross being greater than $100,000 based on the observation that for all the Golden Globes won since 2000, none of the movies grossed less than $100,000. It was also noted that the paper by Apte, Forsell and Sidhwa made the same assumption. Based on this subset of movies, we then selected the actors and actresses who were in the first four billed positions, as well as the writers and directors. By taking only the actors and actresses in the first four billed positions we further reduced the number of people to scrape data for. The assumption behind this is that the important lead and supporting roles are included in the first four billing positions. With this, we produce 15 years of celebrity data, and separated the data by year. As an example, for the year 2014, we gathered data on 879 actors from a total number of 91760, 494 actresses from a total number of 51678, 698 directors from a total number of 9642 and 1062 writers from a total number of 12950.
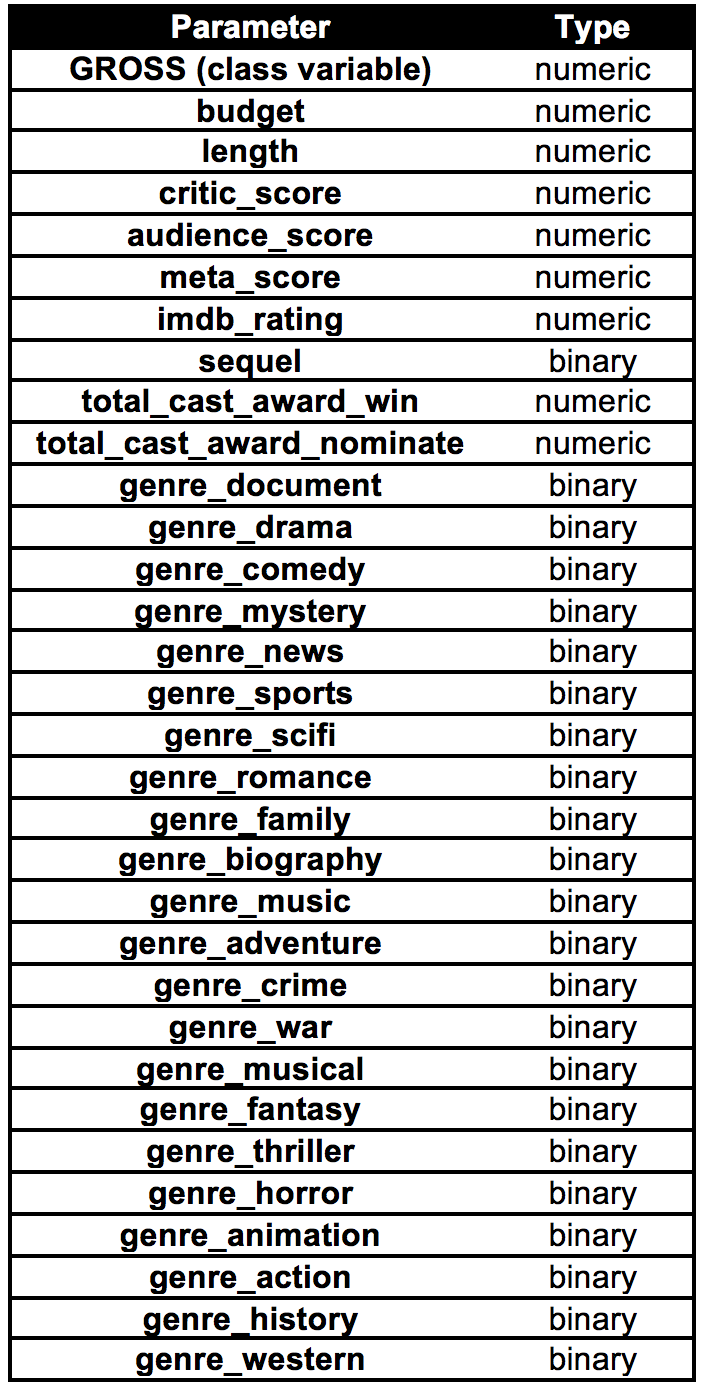
The pamameters chosen for Movie Gross Prediction are shown as follows:
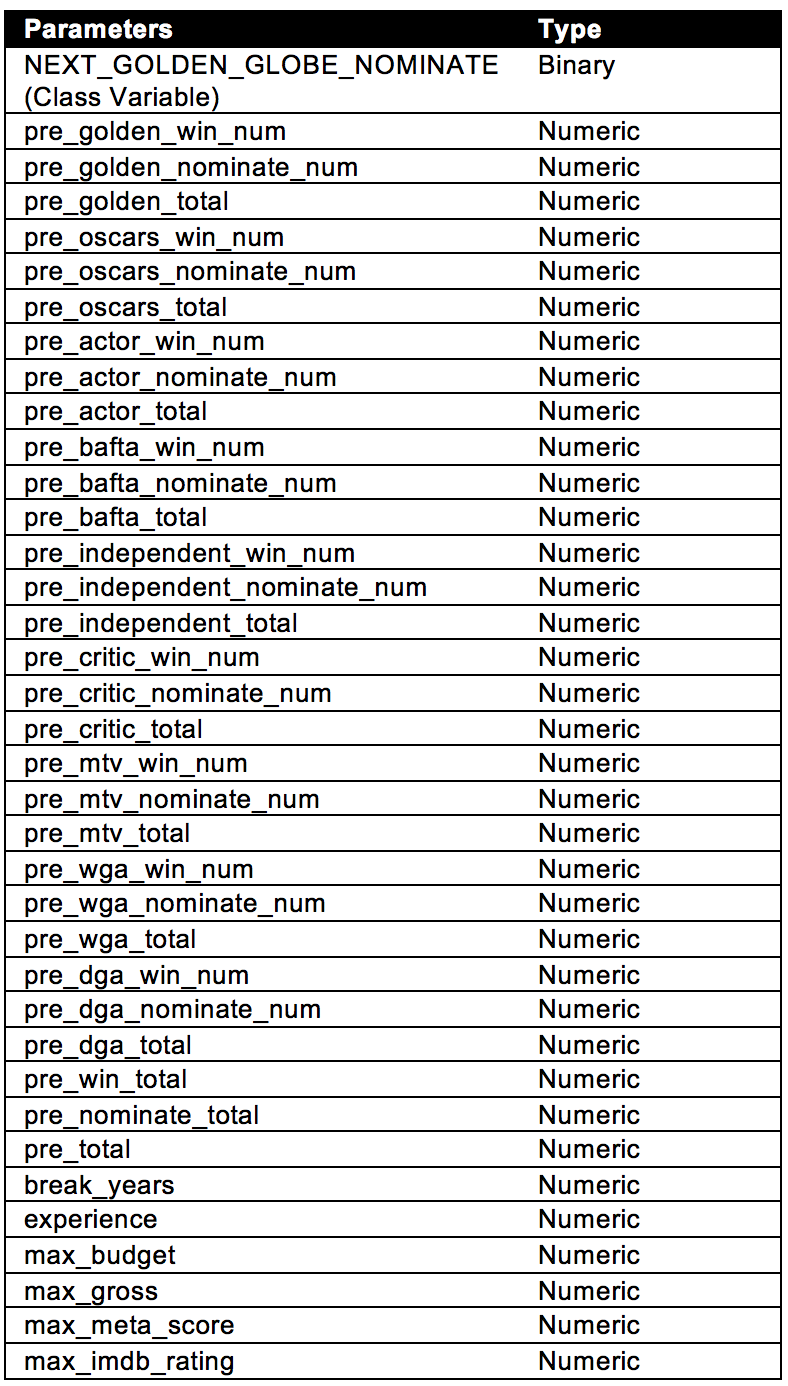
The pamameters chosen for Golden Globes Prediction are shown as follows:
Because we wanted to use different models for low grossing and high grossing movies, we classified movies as low grossing if their gross was less than $69,150. Movies grossing greater than that amount were classified as high grossing movies.
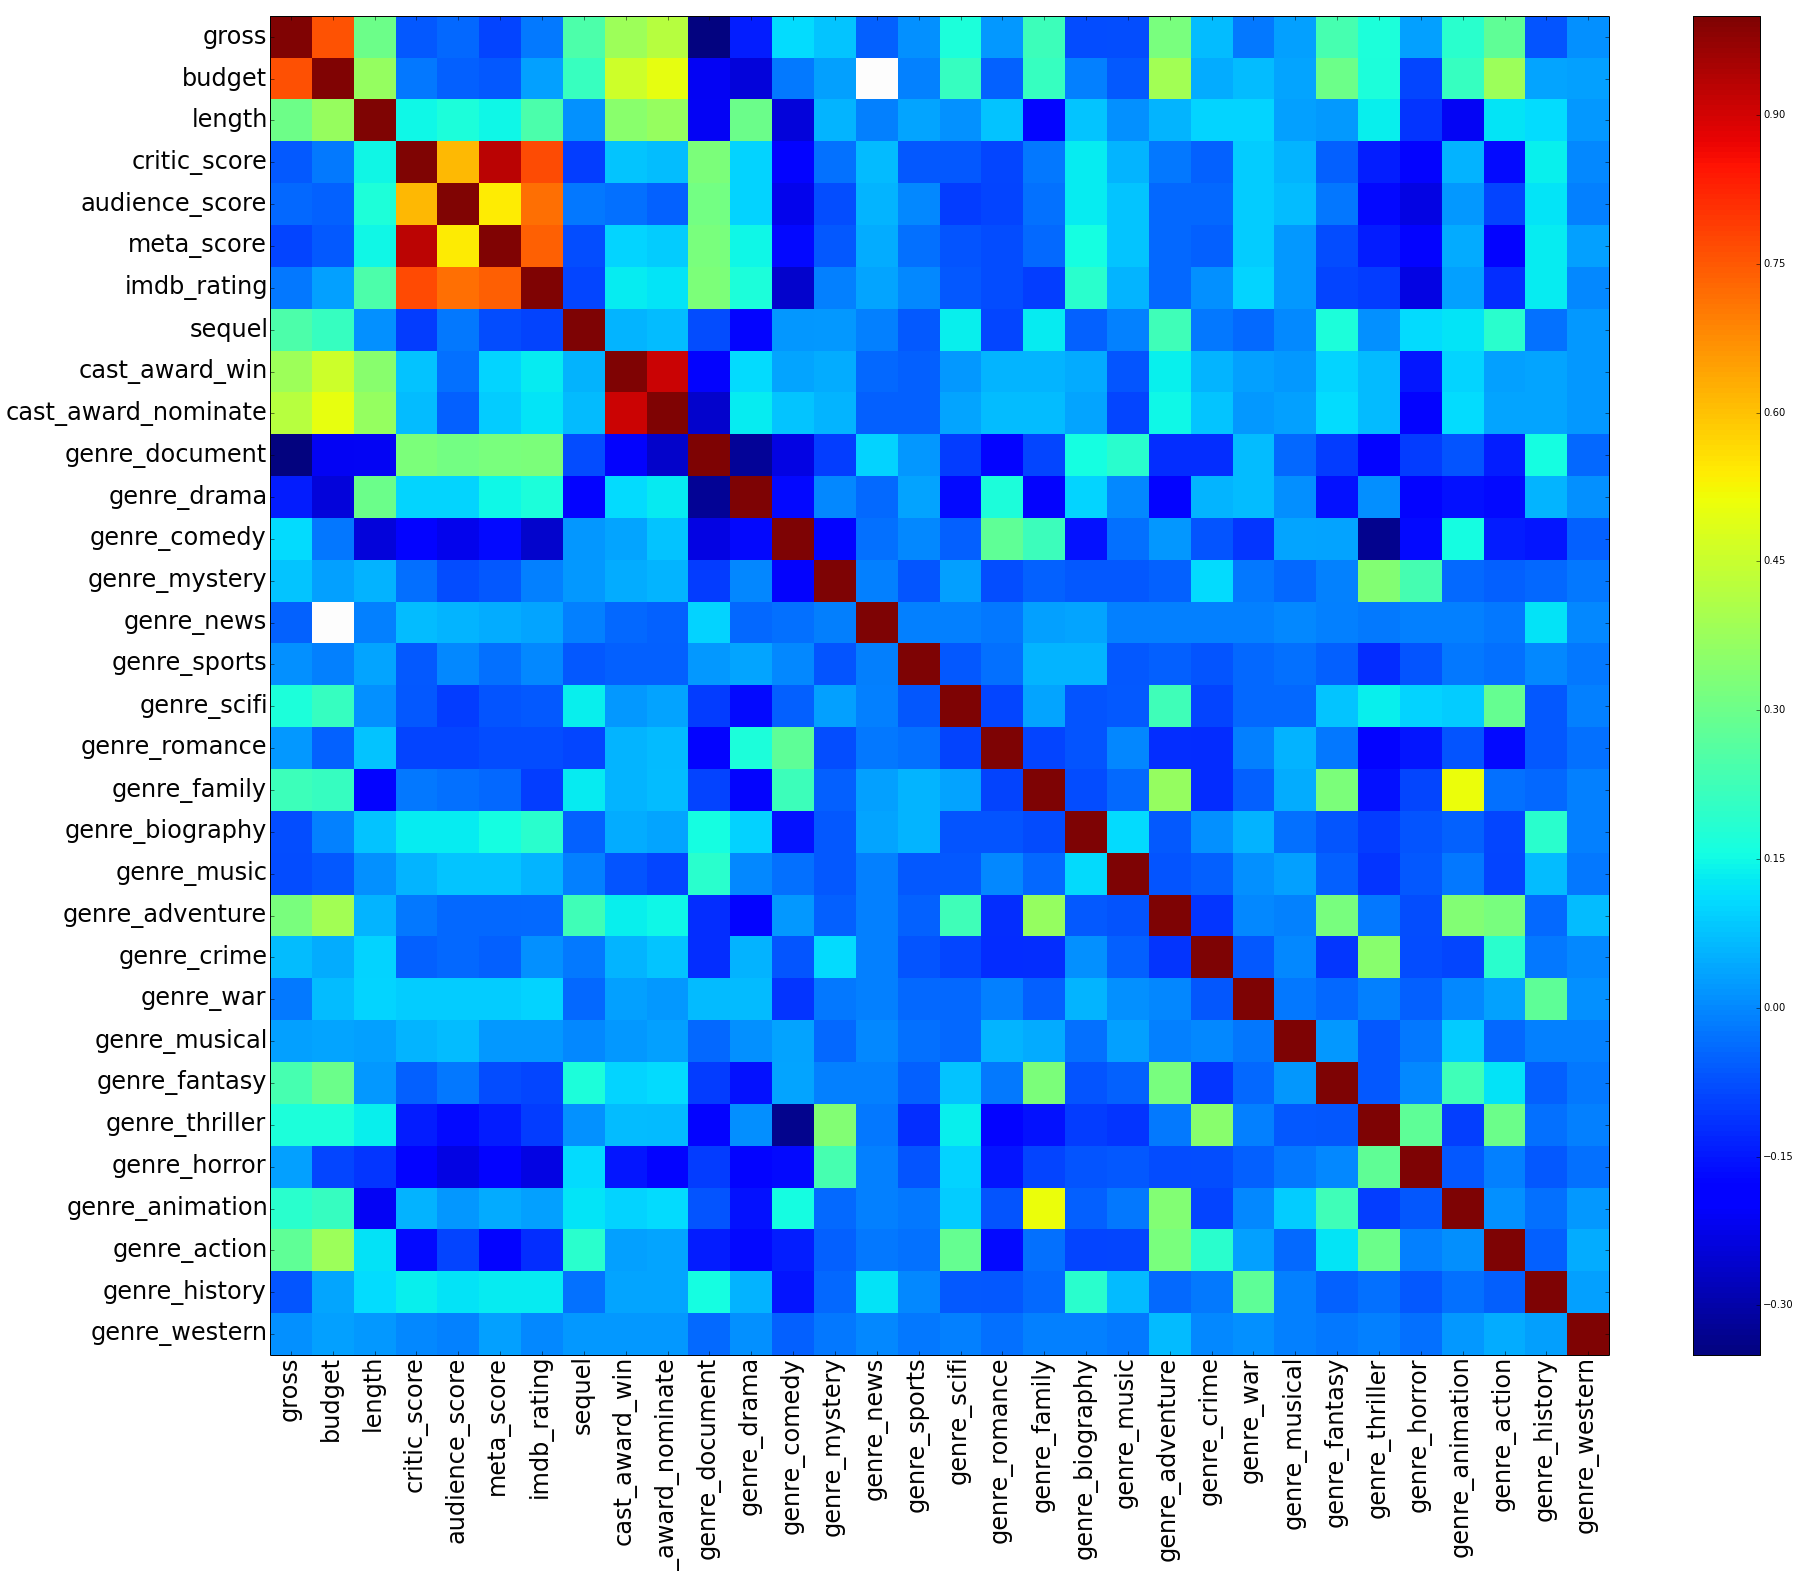
We can see from the correlation matrix in the above figure for high grossing movies that there are several categorical variables that have high correlations with gross. We can see that budget, total cast award win, total cast award nominate, as well as genre adventure and genre action all have good correlation with gross. The genre document variable has a correlation coefficient of -0.30, meaning that documentary movies have a negative correlation with gross.
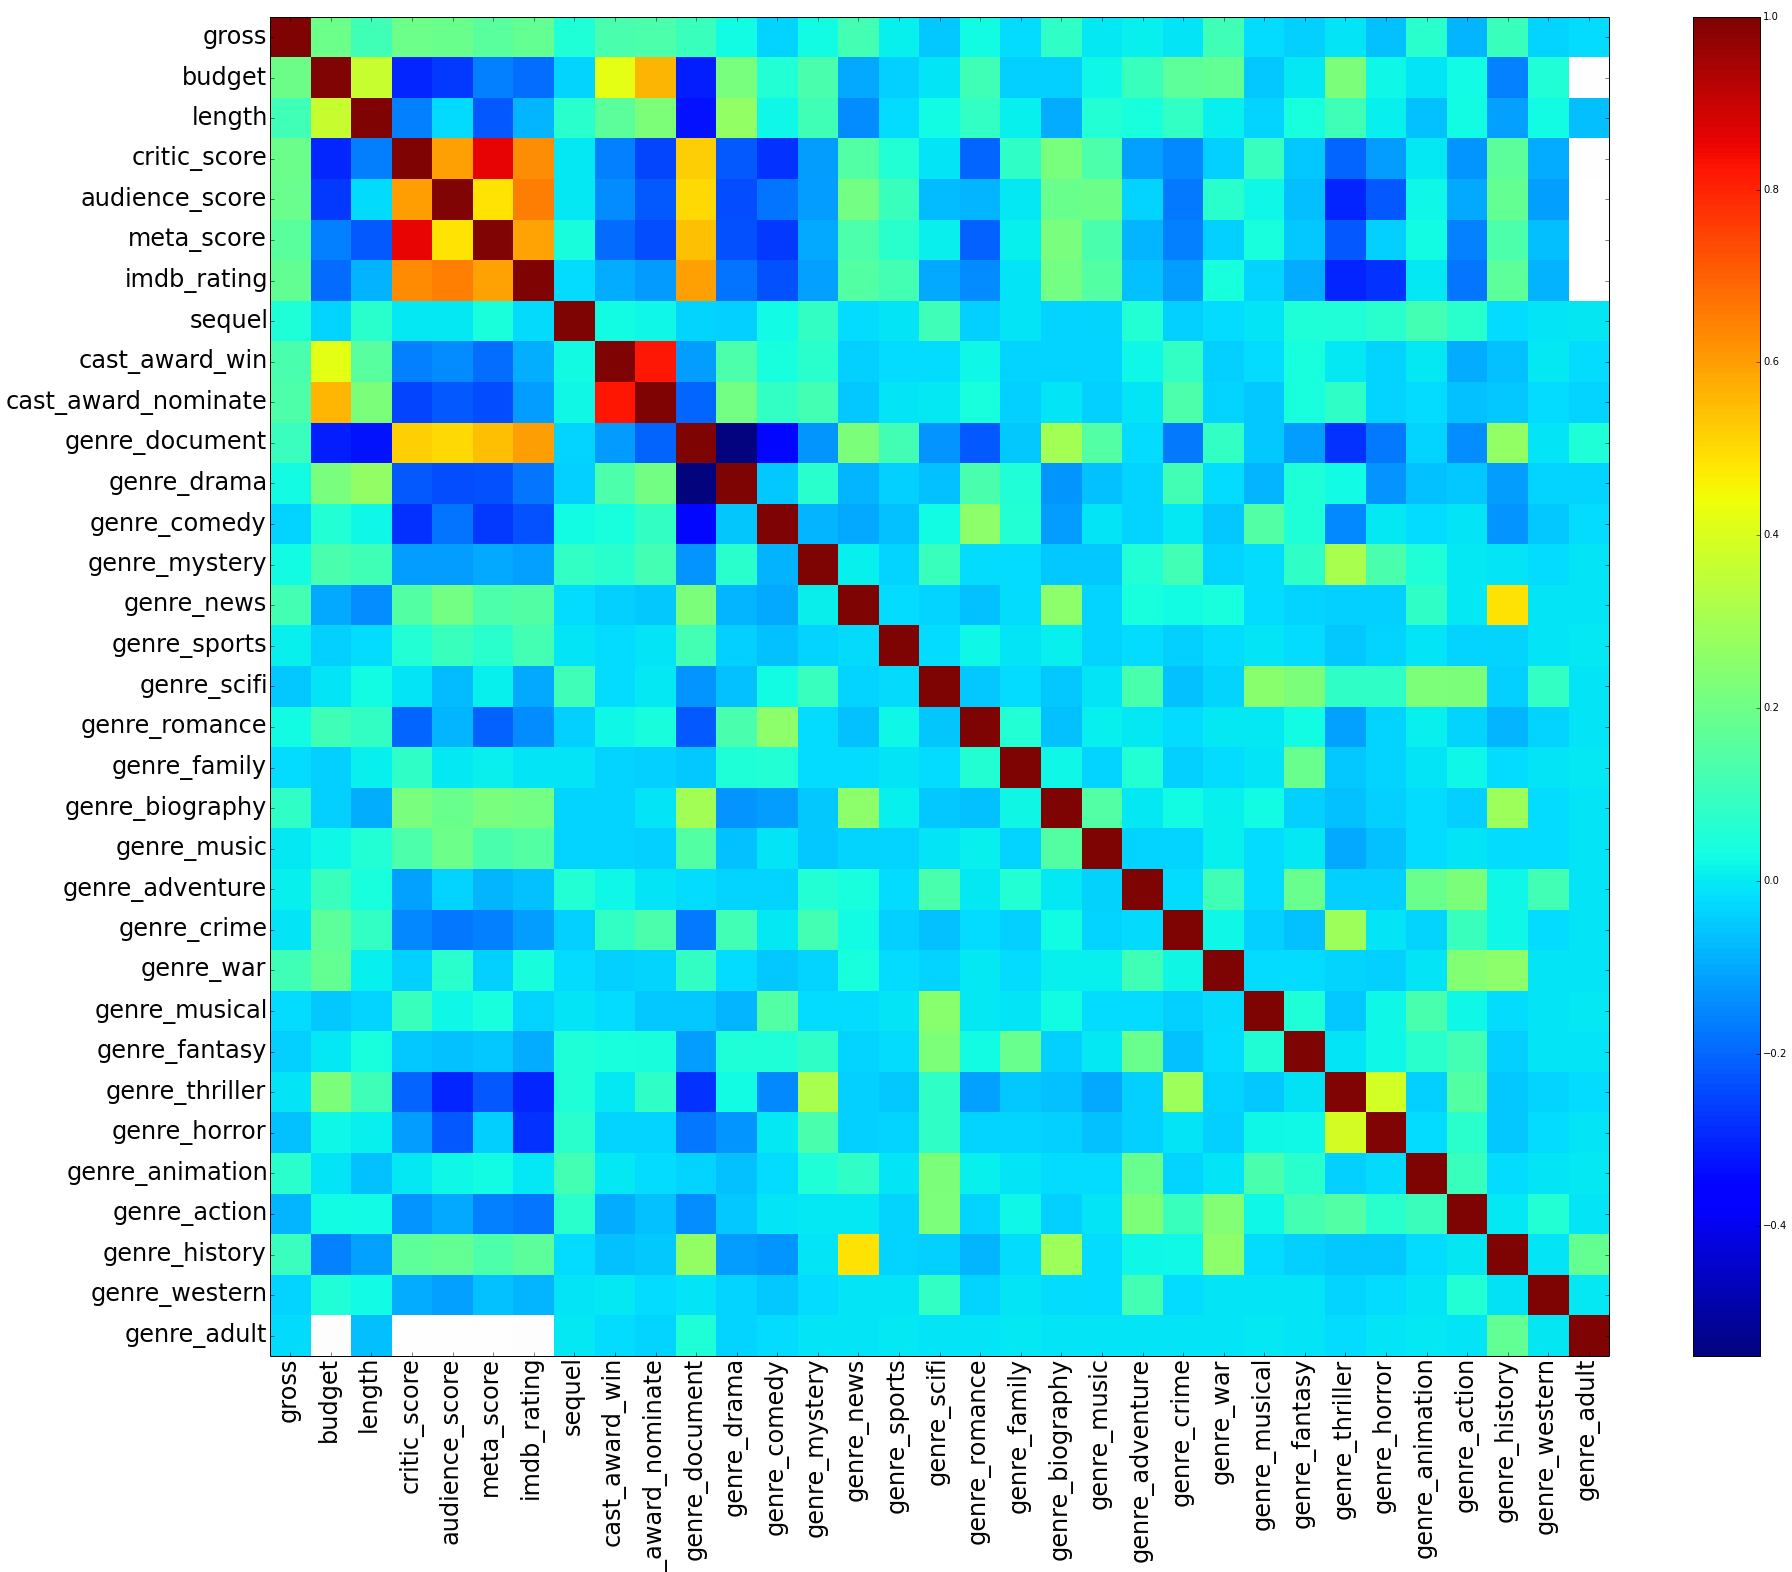
We can see from the correlation matrix in the above figure for low grossing movies that we do not have very good correlation coefficients with gross. The majority of coefficients hover around 0.0 to 0.2. It is apparent from this correlation matrix that we do not have strong categorical variables to make a prediction when compared to the high grossing movies.
As there are large number of parameters in our model, we show the correlation matrix with respect to the class variable Next golden nominee in the figure given below for actor category.
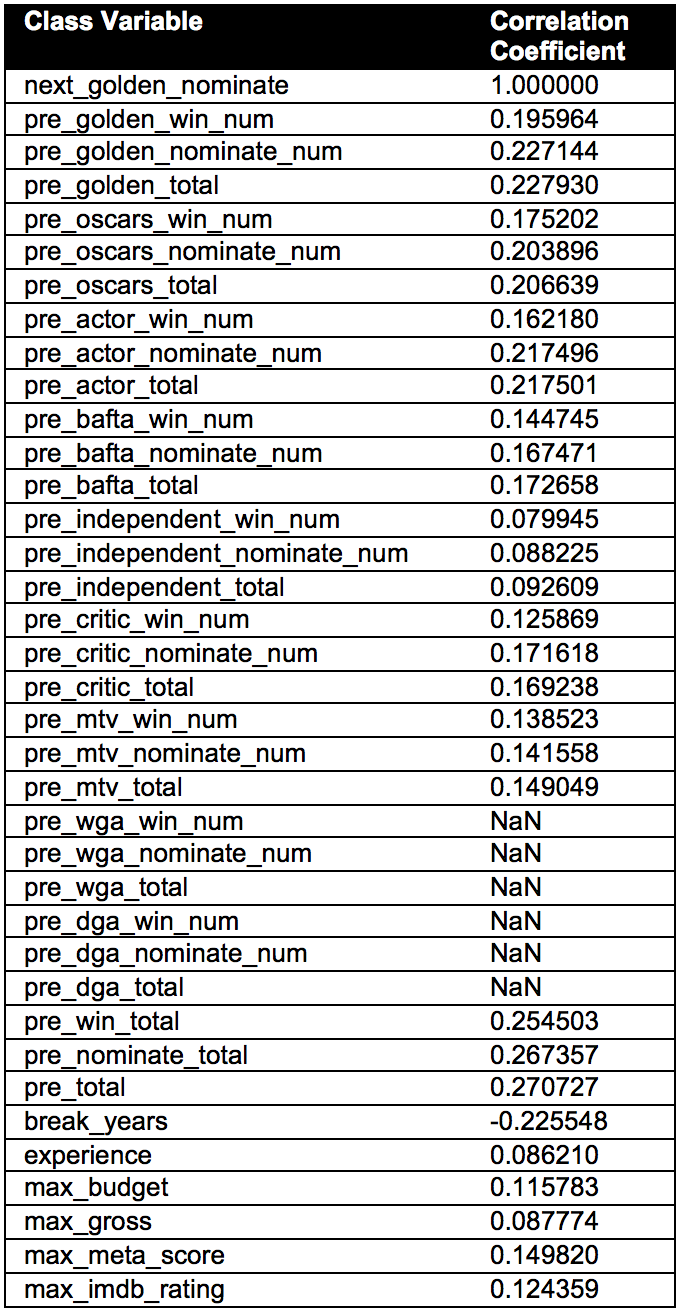
We can see that we have a high correlation with the total number of past awards with respect to the next nominee class variable. This feature is considered in our baseline model. Following were some of the interesting observations we found with respect to actors.
1. The previous cumulative sum of Golden Globe nominations and Golden Globe wins are highly positively correlated with the class variable.
2. The number of break years, that is, the different between the first movie year the actor was casted and the present year of the instance object, is highly negatively correlated with the class variable. From this we can infer that actors who have a lower value for break years have a higher chance of getting nominated for Golden Globes.
3. Some of the interesting awards which are also highly correlated with the class variable are "Total number of Oscar Wins/Nominations", and "Total number of Screen Actor Guild Awards".
4. Another interesting observation is that the class variable is not correlated with the experience parameter (number of years the person is in the film industry - industry years).
The correlation matrix between the class variable and the other parameters for director category is shown below.

We observe from above table that the class variable is highly correlated with the total number of past nominations as observed for actors.
Following were some of the interesting observations noted here:
1. We observe that the number of break years is highly negatively correlated with the class variable similar to actors.
2. Some of the significant awards which have a high correlation with the class variable for the director category are similar to actors: Total number of previous Golden Globe nominations and Total number of previous Oscars.
3. Another interesting observation is that the "Director Guild Awards" and the "Critic Choice Awards" have a high correlation with the class variable.
Genre of the movie is one of the important parameters for predicting the movie gross based on previous research. The IMDB dataset defines 21 genres and BoxOffice Mojo has these genres into sub categories. Some of the genres like "Family" and "Action" are positively correlated with gross whereas genres like "Documentry" are negatively correlated. For our baseline model, we considered the average movie gross of each genre as the gross for movies belonging to that genre.
In this model, we considered 21 genres and in order to have a visual representation of the movie gross based on genre we plotted a with average movie gross along the y axis.
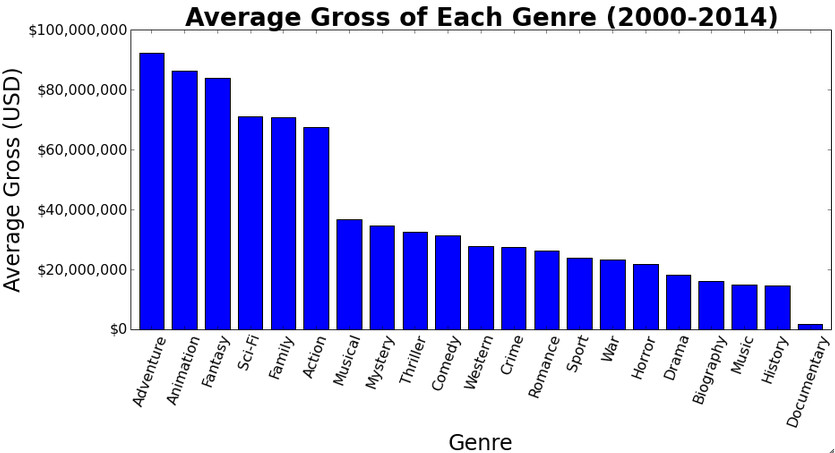
From the histogram above, we observe that movies which are sci-fi, family, adventure, fantasy, animation, and action have a higher average gross. Since our baseline makes a simple prediction for a movies gross based solely on its genre, we expect large errors for situations where an unpopular movie is assigned a large gross simply because it fits under a certain genre.
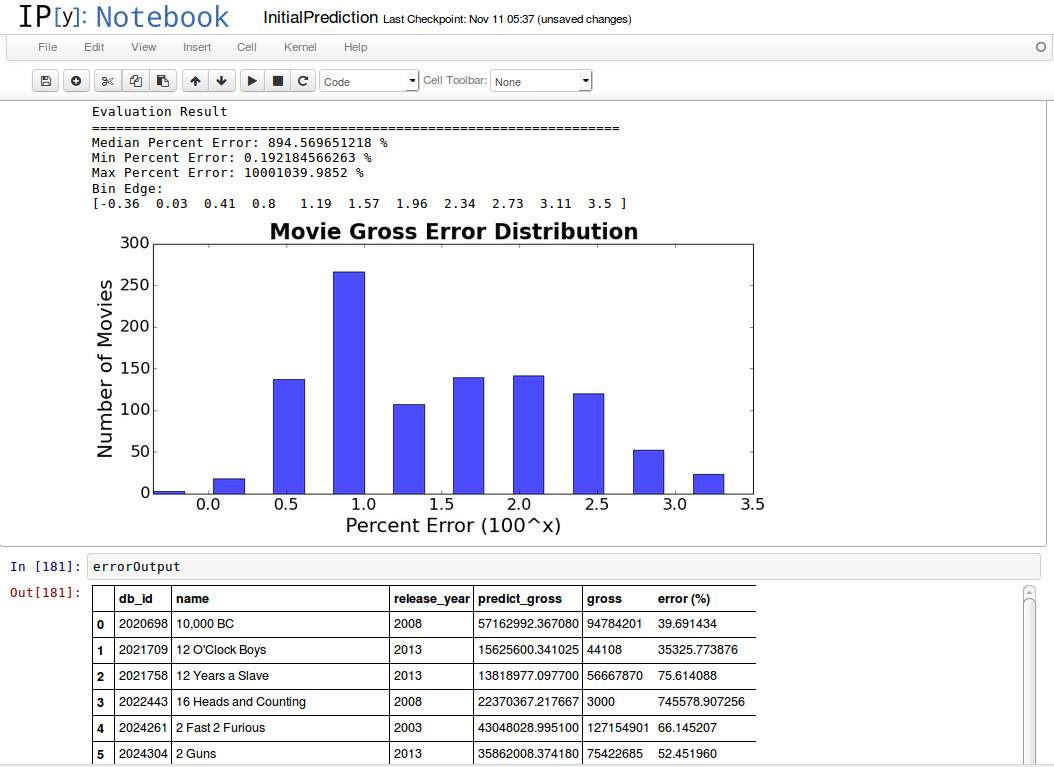
We evaluated our baseline model and observed the error distribution as shown above. The baseline shows that there is a huge error with our baseline model. We found that the max percent error is 10,000,000% which is because of certain low gross movies(there are movies with gross < $700) that fell into the high grossing genre buckets like adventure, action or sci-fi which have an average of $70 million gross.
In basic linear regression Model, we visited all the parameters we can use from our dataset, and we observed that audience score" and critic score" had a very low P-value which can be considered as an important parameter for fitting a linear regression. Thus we considered the following parameters for our final linear regression model - budget,length, sequel, theater, critic score, audience score. We also obtained the error distribution and R-square value for the above linear regression is 0.6407 which is more than the model which considered only the budget as dependent variable.
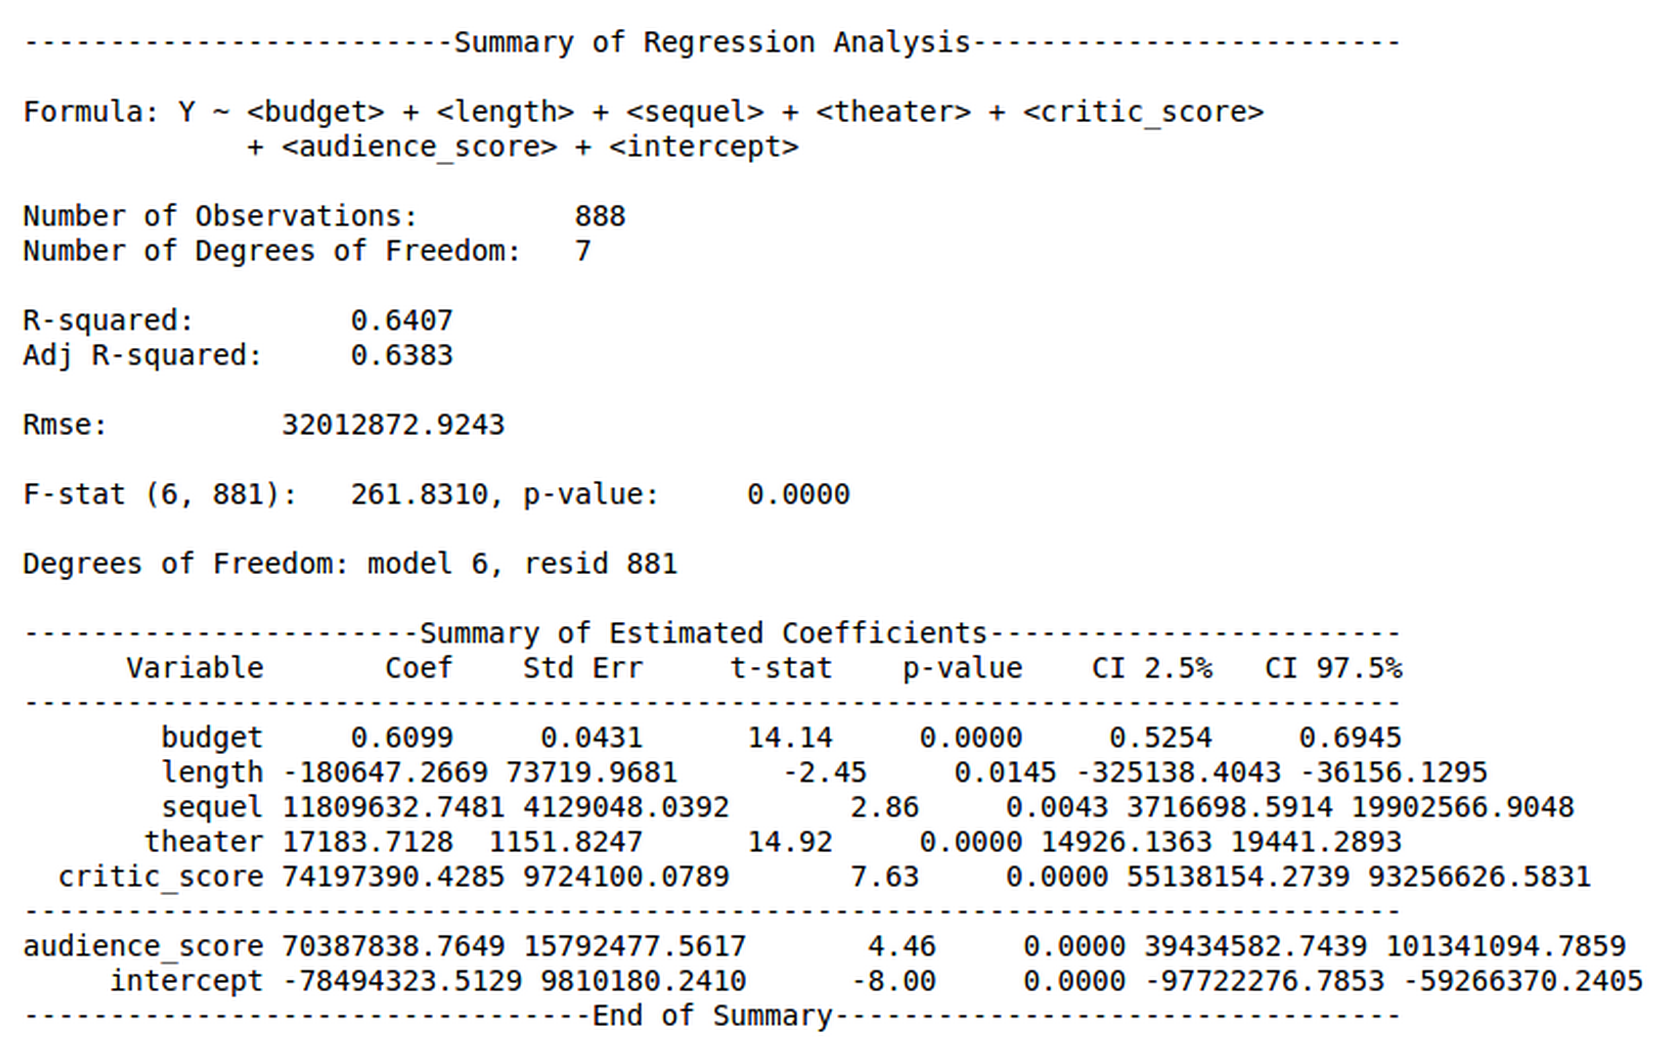
When we compare the results obtained from our current model to our baseline model shown above, we can observe that our median error percentage is reduced by an order of magnitude. The error statistic displays absolute error in order for us to discern whether or not our model is producing underestimates or overestimates. A large maximum error still exists, but is also reduced significantly compared to the baseline maximum percent error.
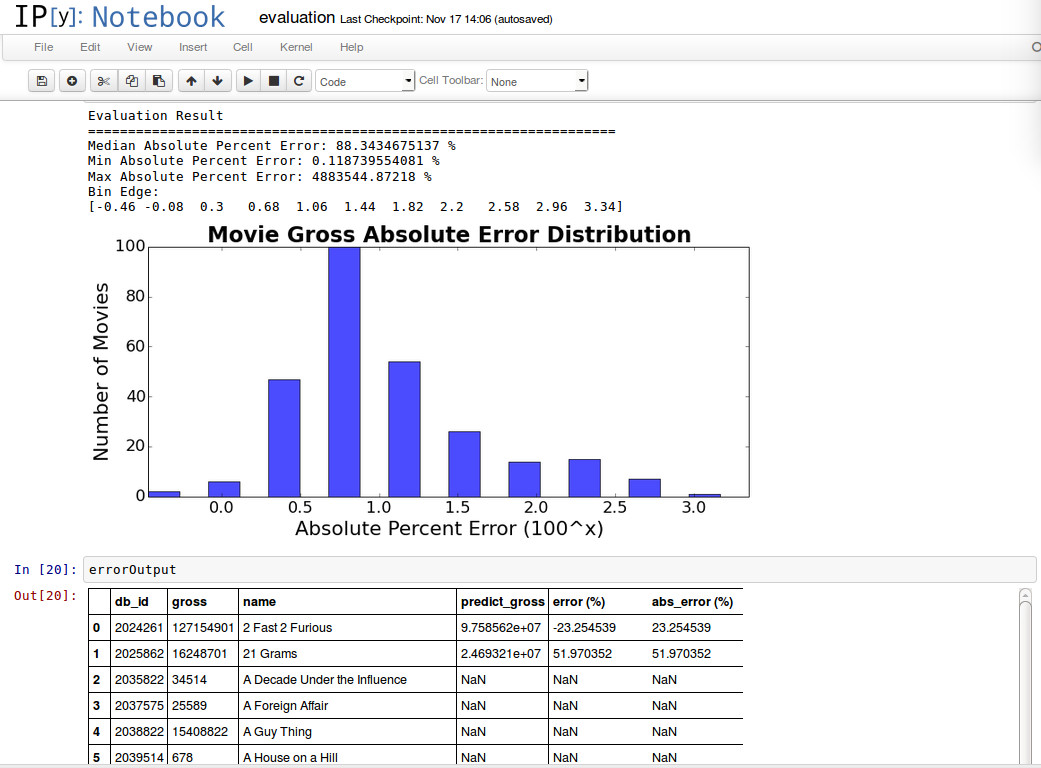
Comparing our linear regression with the baseline model, following were the results

Our baseline model for predicting the Golden Globe Awards is to calculate the total number of past awards nominations or wins by the person before that particular year. The celebrity who has the highest number of past awards has a higher probability of winning the next Golden Globe award.
The following shows the favorability of nominations for 72nd Golden Globe Awards in January 2015 for each category separately.

For our advanced model, we realized that the number of theaters was a parameter that is not available until several days after the movie is released.
The following flow chart represents our workflow to predict the movie gross. First the movie is classified as either a high or low grossing movie using a J48 decision tree model. Movies classified as high grossing are separated where a M5 pruned tree model is applied. For low grossing movies we apply a M5 rule based model
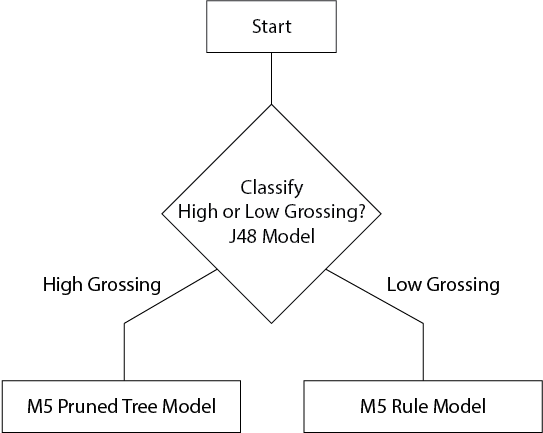
By leveraging our data scraped from the awards page for all of our actors, actresses, directors, and writers, we were able to add two parameters: "total cast award win" and "total cast award nominate". Based on our observations during our exploration of the data and baseline model, we determined that separate models should be applied for high grossing and low grossing movies. To address this, we trained a classifier to separate high grossing movies from low grossing movies.
Summary statistics comparing models to classify movies as high grossing or low grossing movies:
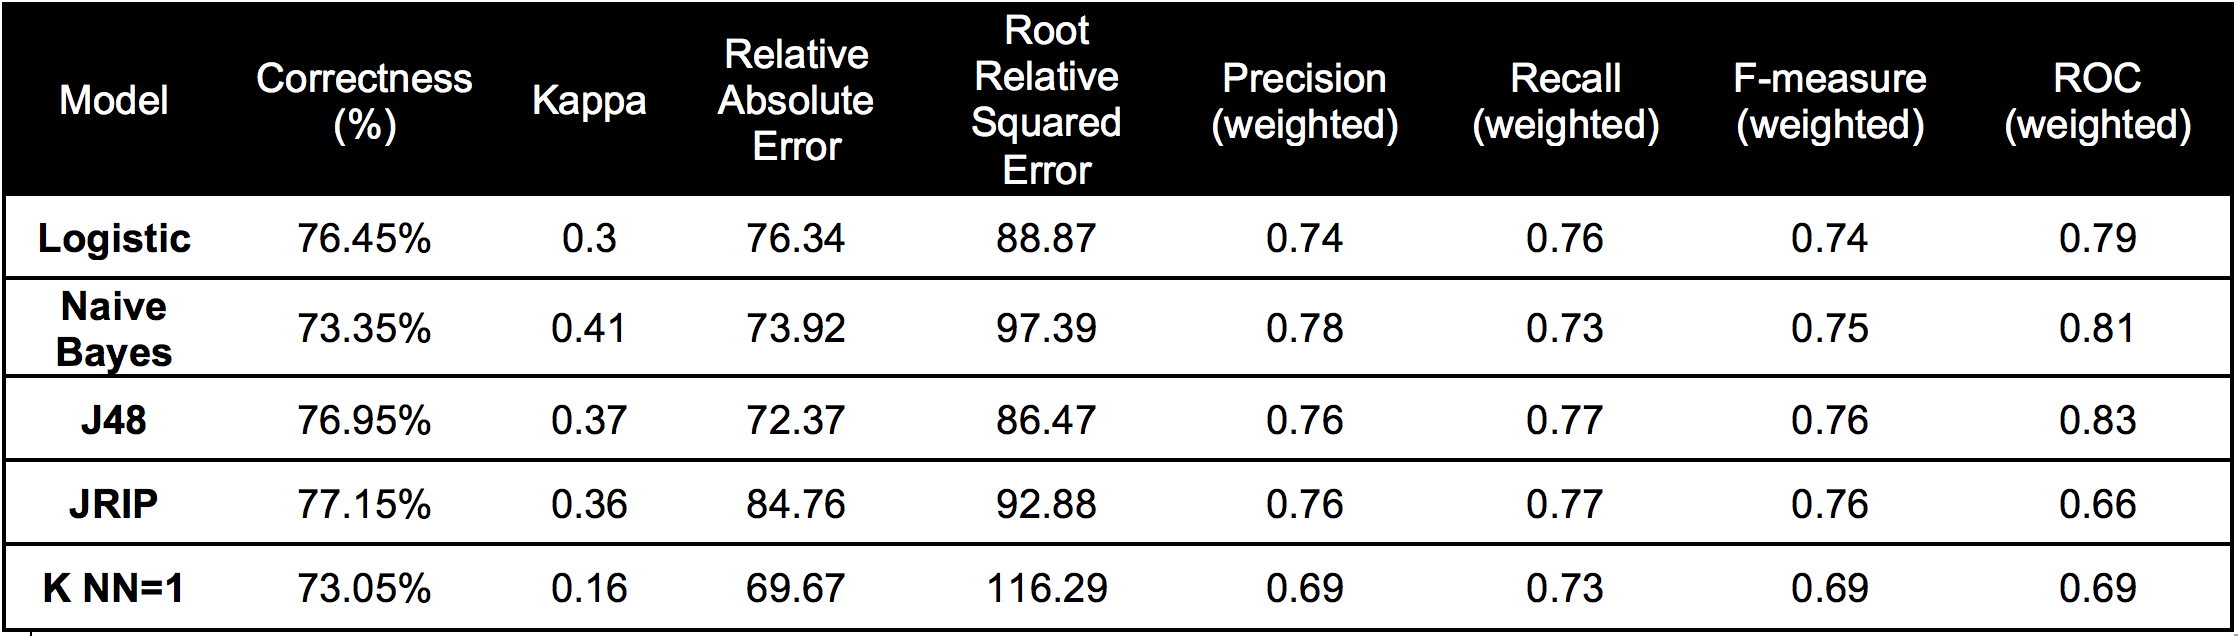
Using our training dataset, we tested several classification models and selected a J48 decision tree to classify which movies were high and low grossing. We also tested: logistic regression, naive bayes, JRIP, and k-NN. Based on the summary statistics from figure 27 we selected the J48 decision tree primarily because of its high f-measure score, high ROC, and low root relative squared error when compared to the other models that we tested.
After our classification step that splits the dataset into a high grossing movie dataset and a low grossing movie dataset, we tested models on each dataset and compared their performance.
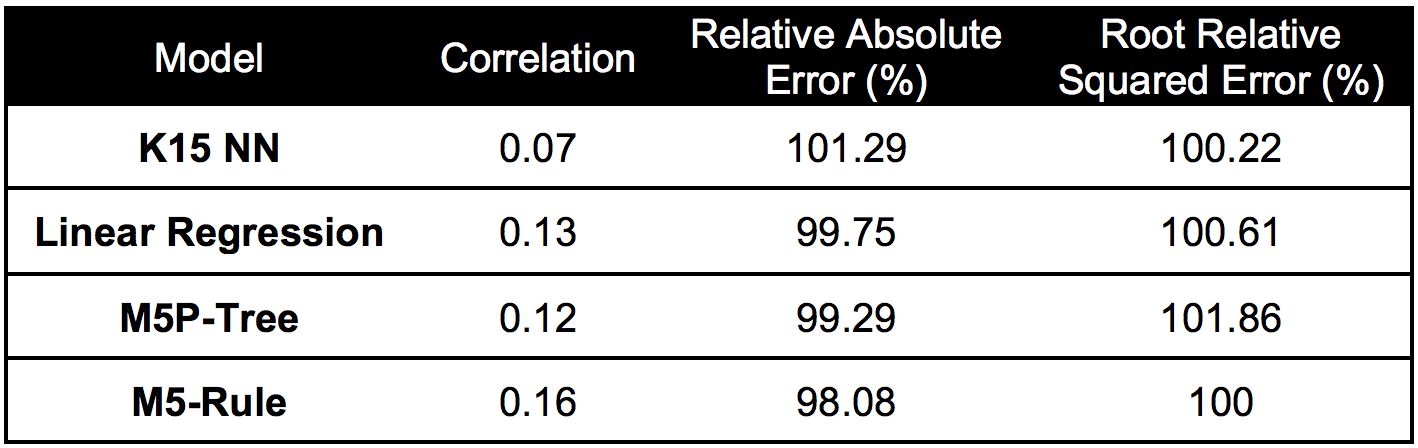
Summary statistics comparing models for predicting high grossing movies:
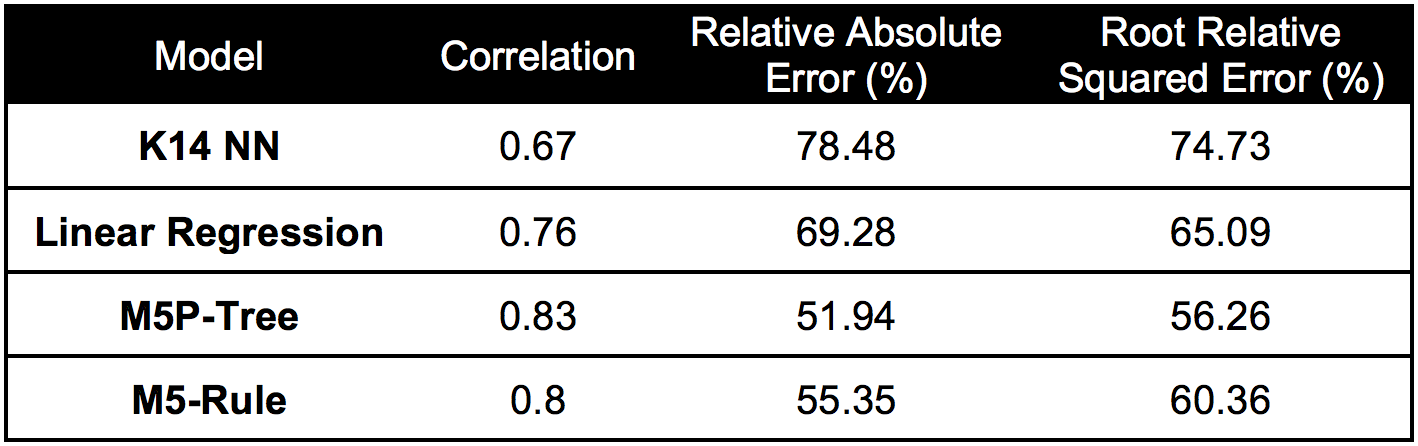
From inspection of the M5 pruned model tree, it is interesting to observe that the budget is the attribute that differentiates the movies the most. Additional parameters used are "audience score", which was a social media parameter based on audience ratings of the movie scraped from IMDB, "critic score", and the genre. The "total cast award nominate" parameter mentioned previously is also a deciding parameter in the tree.
Error distribution histogram for the high grossing movies:
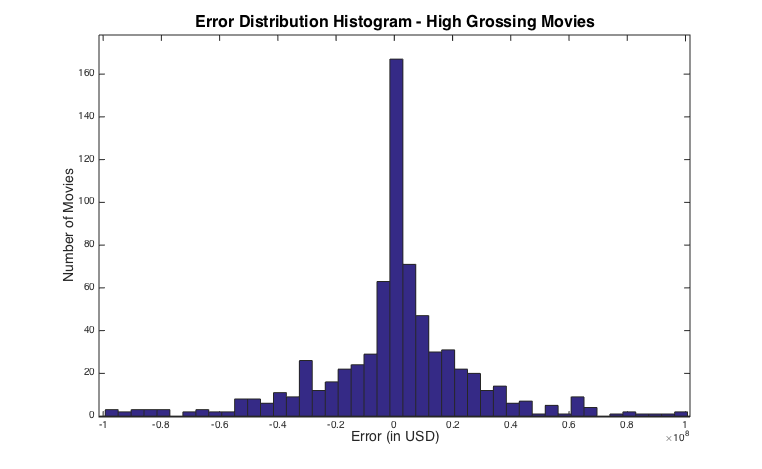
From inspection of the data, it is also apparent that the errors are compounded when the classification model does not correctly classify the movies as high or low grossing. If a low grossing movie is thrown into the high grossing model, the error is very high for those movies.
Summary statistics comparing models for predicting low grossing movies:
Based on the comparison of the summary statistics for model performance on low grossing movies we chose the M5 rule model.
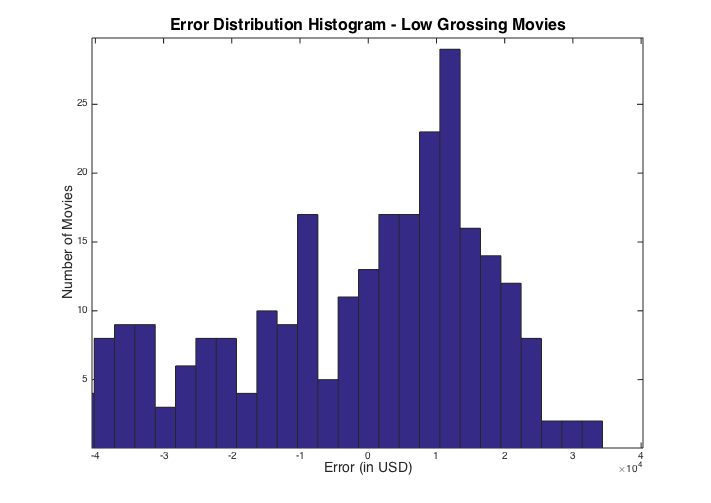
Error distribution histogram for the low grossing movies:
Until this point, our models and predictions have focused on predicting the total domestic gross of the movie. The total domestic gross is the amount the movie grossed from all theater ticket sales, for all the days it was shown. We adopt this method because of the lack of daily gross data. In order to predict how much the movie will gross specifically on Christmas Day we applied a relatively simple technique to extract this from our model. Our approach was to determine what percentage the Christmas Day gross was of the domestic lifetime gross of a movie. We went through BoxOfficeMojo and looked at all movies from 2002 to 2013 that were released up to 7 days before December 25 and recorded their Christmas Day gross as well as their domestic total gross. BoxOfficeMojo only has daily gross data from 2002 to 2013. From the 125 movies from which the data was available, we found that that on average (median), the gross on Christmas Day represents 5.99% of the total domestic gross. We simply apply this percentage to our predicted total domestic gross to establish our Christmas Day gross prediction.
In this model, we evaluate each award separately. We analyse the predictive power of each individual award considering them as individual features in this model. We have the cumulative sum of the number nominations and wins for each celebrity for each award separately prior to the year of consideration. We used different classifiers to evaluate the model and plotted the error graphs.
As an enhancement to the model, we extracted the year of the first movie the celebrity was casted and the year of the first significant award he/she was nominated or won. We then calculated the different between the years and termed this new feature as "Break Years". This gives us the number of years the celebrity took to achieve his/her first nomination. We also calculated the "industry years" by considering the number of years after the celebrity was casted in his first movie. As a second enhancement to the model, we then combined some of the movie features from our movie gross project. We obtained the gross, budget, the imdb rating and the metacritic score associated with the movie the celebrity was casted in that particular year.
We observed that the results were affected by the skewness of the data.We had a large number of celebrities in our dataset who were not nominated compared to the celebrities who were nominated at least once. We used a simple logistic regression to reduce our dataset to a non-skew dataset for obtaining better results. For our new set, we first considered the actual nominated celebrities and to this set we add the celebrities who were predicted to be nominated by our simple logistic regression classifier. In order to bolster the model we added celebrities who have high probability of being nominated. After this step of sampling we rerun our model using this new dataset. So we have two models, Model1 which was built on the entire dataset and Model 2 was built on the sampled dataset.
For model 1 we used different classifiers and following were the results on testing data set under each category.
For actor category, KNN classifier performs better compared to other classifier.
For actress category, Naive Bayes classifier performs better compared to other classifier.
For director category, RIPPER classifier performs better compared to other classifier.
For writer category, RIPPER classifier performs better compared to other classifier.
We now consider the weighted precision and recall as our dataset is no longer skewed.
For actor category, KNN classifier performs better compared to other classifier.
For actress category, Naive Bayes classifier performs better compared to other classifier.
For director category, RIPPER classifier performs better compared to other classifier.
For writer category, RIPPER classifier performs better compared to other classifier.
Our final movie gross prediction is in the included table below. Overall we are satisfied with our final prediction based on our time and resource constraints.We have a group of four movies that were classified as high grossing, and are expected to have a domestic lifetime gross of at least $200 million dollars with Christmas Day gross of at least $13 million dollars. The two highest grossing movies, "Into the Woods", and "Unbroken" are expected to have a domestic lifetime gross of $483 million and $437 million respectively. Based on our exploration of the data, these predictions seem to make sense. "Into the Woods" has high grossing genres, including the Comedy and Family genres. Additionally, it includes big names for actors, actresses, directors and writers, such as Meryl Streep (161 award wins, 235 nominations), Emily Blunt (1 Golden Globe win), and director Rob Marshall (1 Oscar win, 13 additional wins, 25 nominations). "Unbroken", an action/drama film, features four time Oscar winning writers the Coen brothers, and is directed by Oscar winning Angelina Jolie. Low grossing films typically have sparse information. It seems that the fact that the movie does not have very much information available intuitively indicates that the film may not gross a high amount.

Our final movie gross prediction for the 20 movies released on Christmas Day. The Predicted Gross column is our predicted lifetime gross of the movie. The Predicted Christmas Gross column is our prediction of how much the movie will gross on Christmas Day (simply 5.99% of the Predicted Gross).
Our final predictions for Golden Globes 2015 for different categories are as shown below. As we are predicting awards for Best Actor in a Motion Picture, Best Actor in a Musical or Comedy, as well as Best Supporting actor, we list the top fifteen nominations from our model output based on their nomination probability, as each category receives five nominations. Following are the predictions of Model-1 and Model-2.
Model - 1_Actor_Nominations:
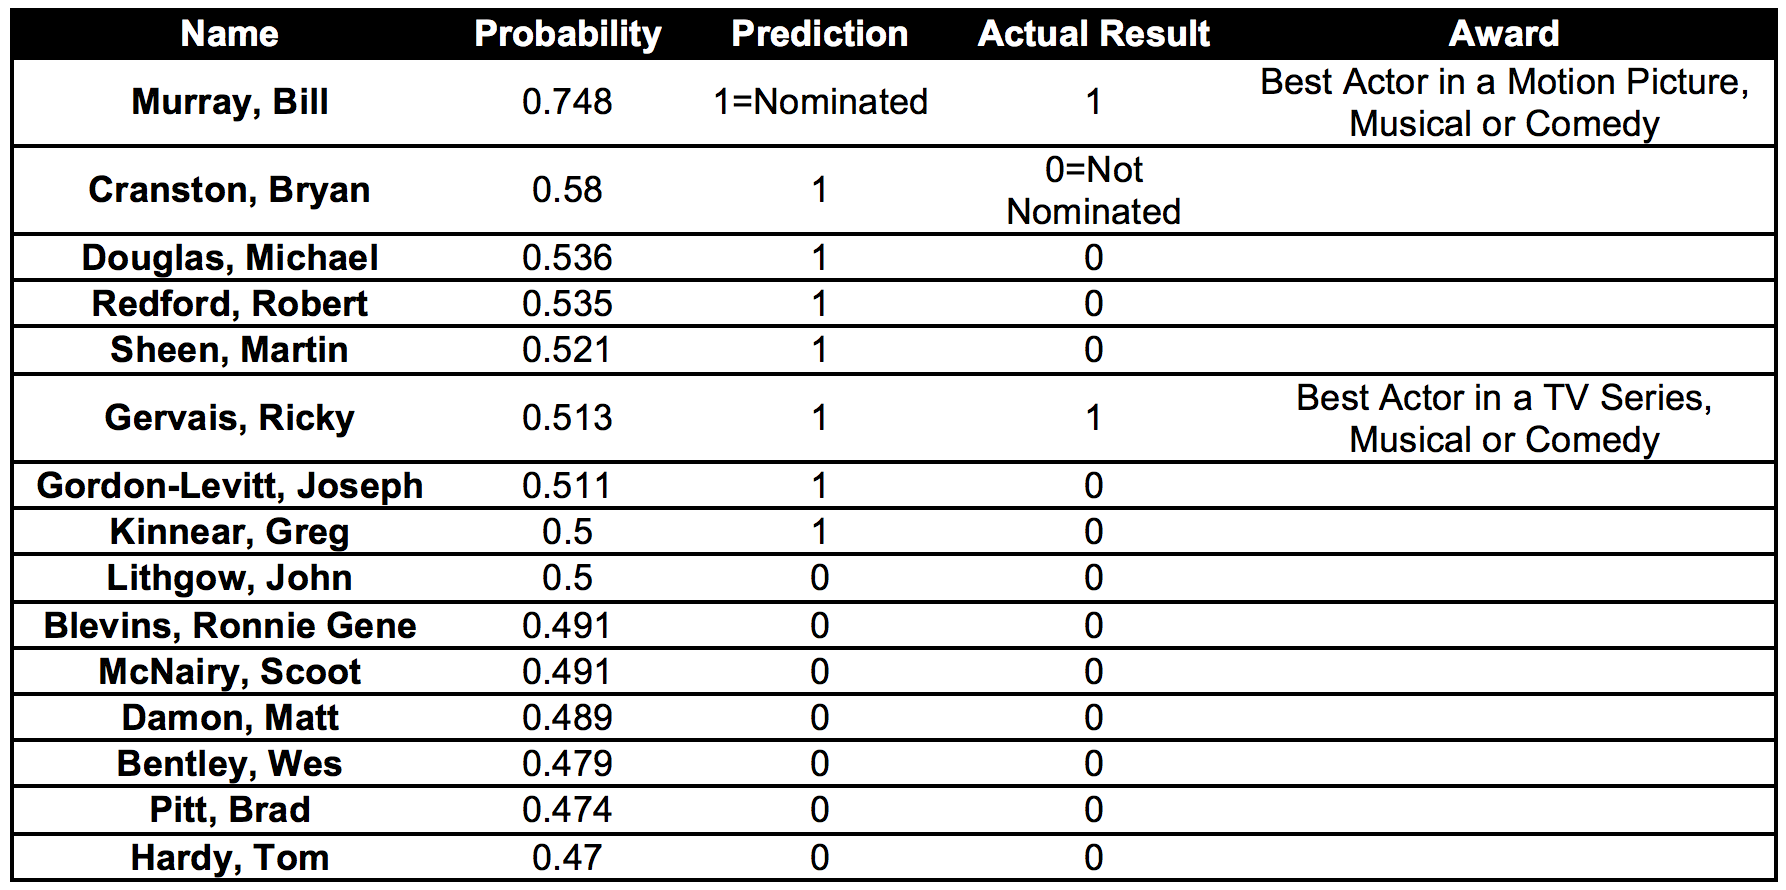
Correctly predict:

Model - 2_Actor_Nominations:
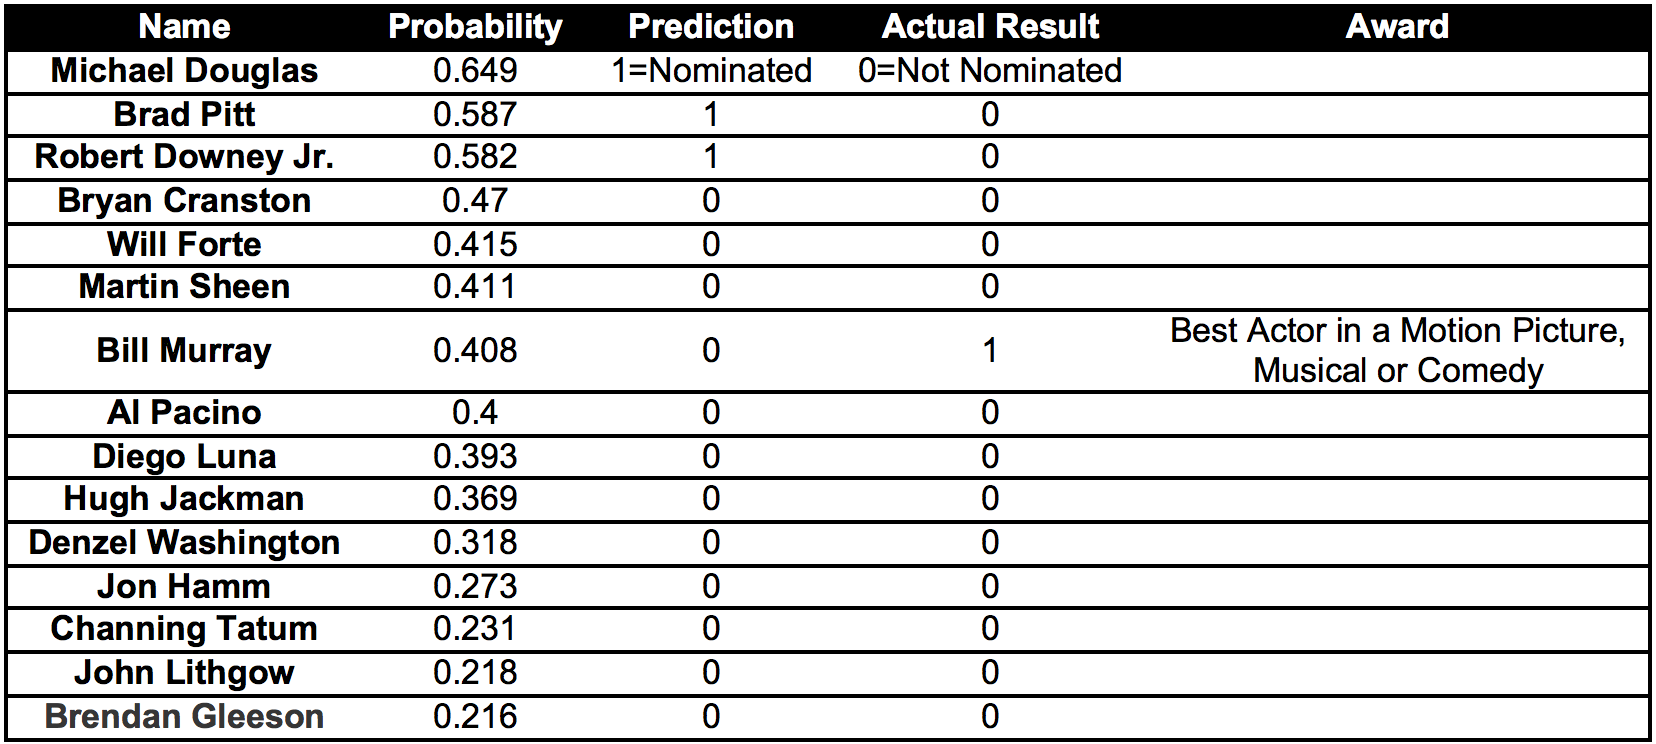
Correctly predict:
From the Table: Model-1 for actors, we can observe that our model correctly predicted Nomination for Bill Murray and Ricky Gervais. However Model-2 could correctly predict only for a single actor. From the results of Model-1 and Model-2, Bill Murray has the highest probability of winning the Golden Globe award 2015 for Best Actor in a Motion Picture, Musical or Comedy.
Model - 1_Actress_Nominations:
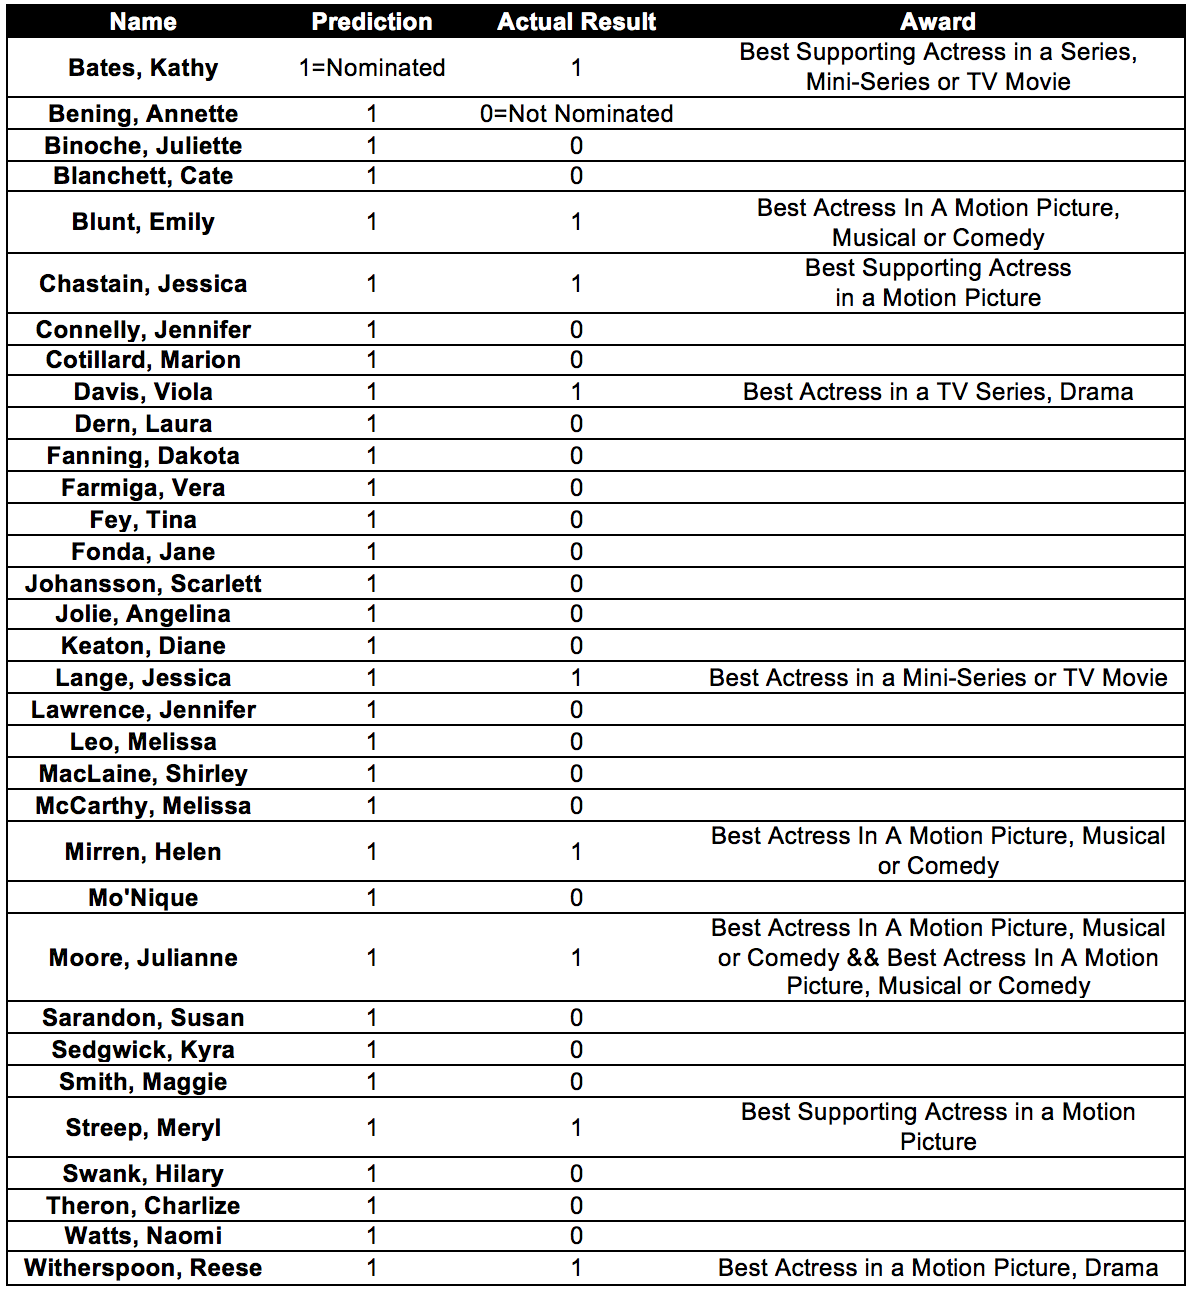
Correctly predict:


Model - 2_Actress_Nominations:
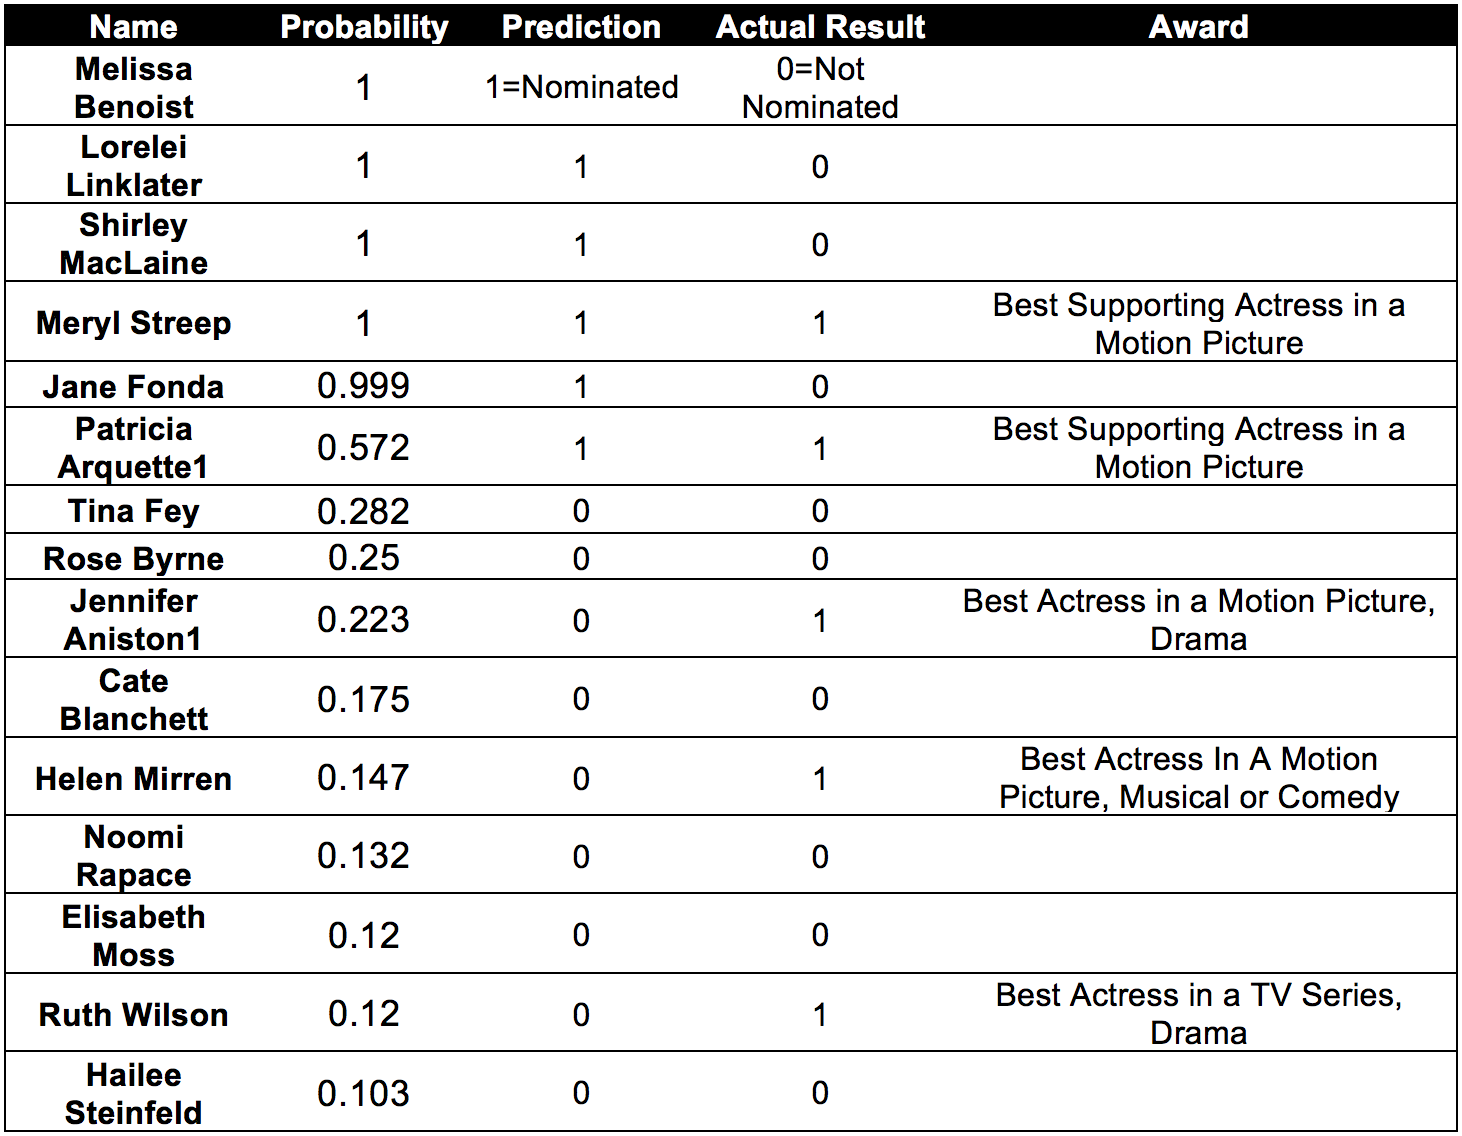
Correctly predict:

From the Table: we see that a large number of actress were predicted to be nominated for Golden Globes 2015, out of which our model correctly nominated 8 out of the 33 actress. However we obtained a very good prediction from Model 2. The total number of actress we considered for nominations were 15 using Model 2, out of which 5 were correctly predicted. From the results of Model 1 nd Model 2, we predict the winners as follows:
1. Best Actress in a Motion Picture, Drama - Jennifer Aniston
2. Best Actress in a Motion Picture, Musical or Comedy - Helen Mirren
3. Best Supporting Actress in a Motion Picture - Meryl Streep
Model - 1_Director_Nominations:
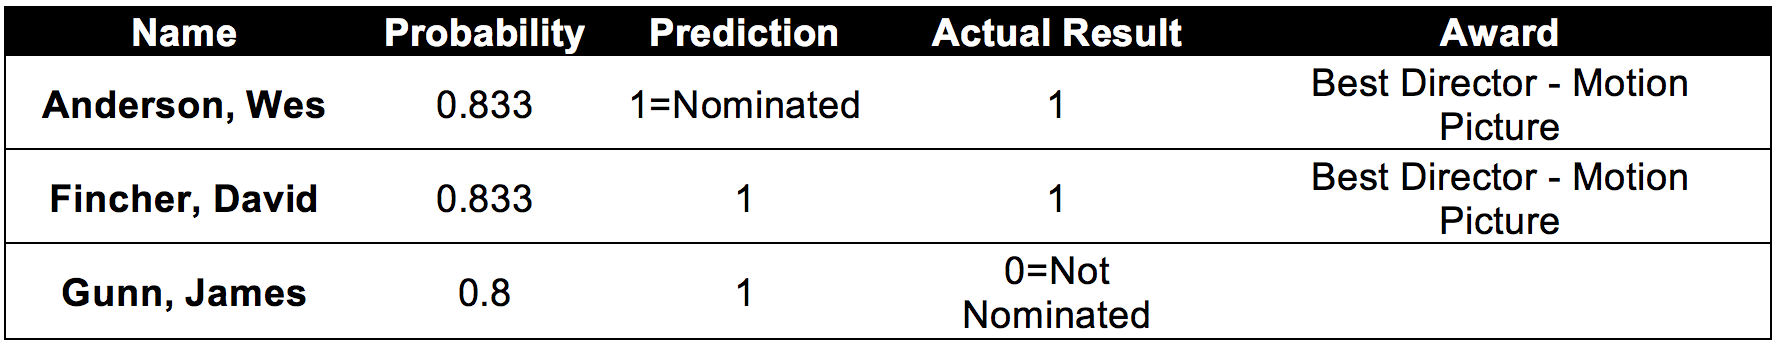
Correctly predict:
Model - 2_Director_Nominations:

Correctly predict:
From Table: the model predicted 3 nominations, out of which 2 were actually nominated. According to Model-1 and Model-2, we predict the Golden Globe award 2015 for the Best Director - Motion Picture will be Wes Anderson.
Model - 1_Screen-writer_Nominations:
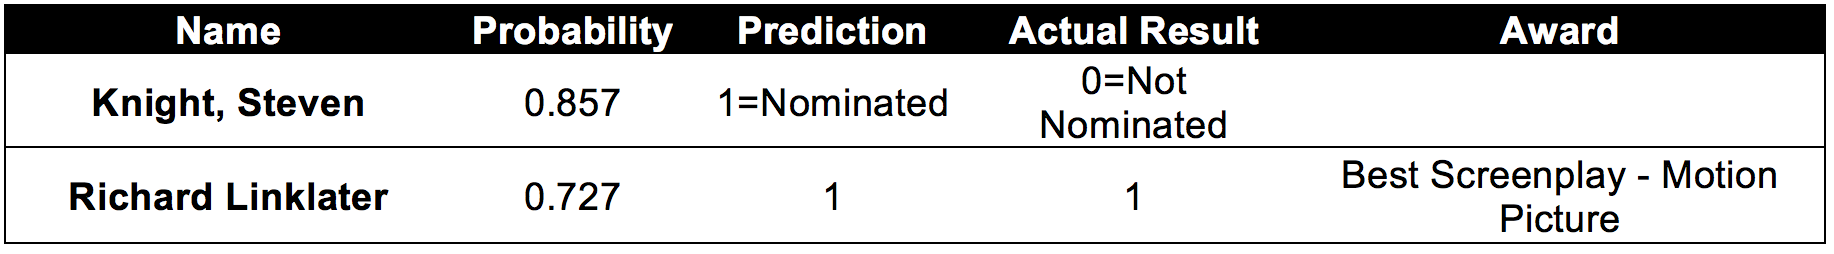
Correctly predict:
Model - 2_Screen-writer_Nominations:
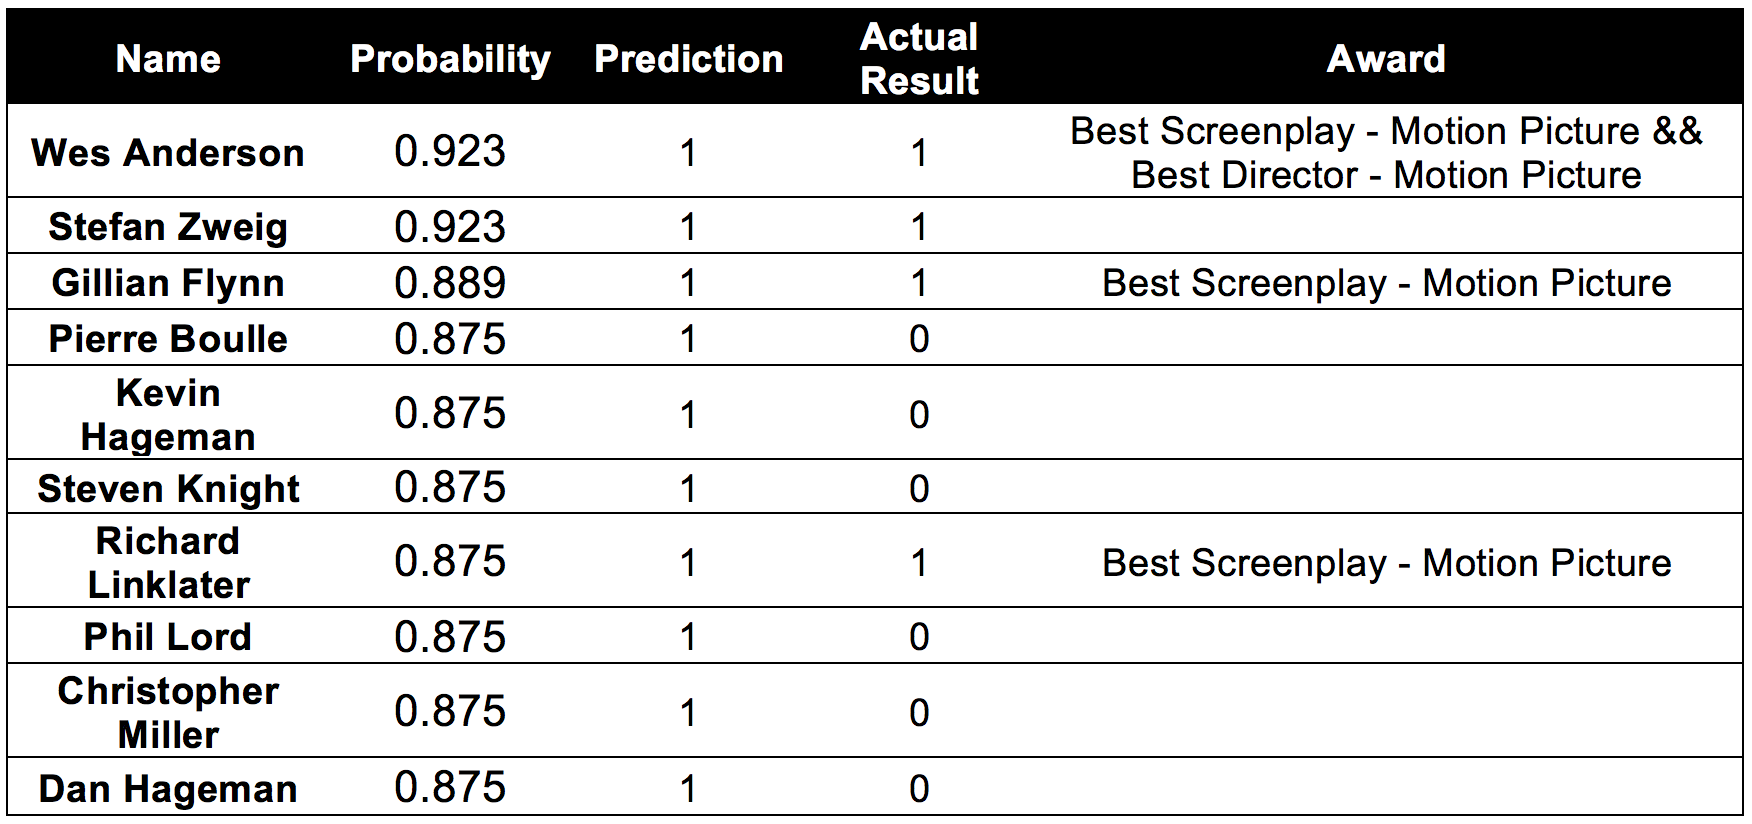
Correctly predict:

From Table-1_Screen-writers_Nominations, the model predicted one correct nomination out of the two predicted.We are very happy with the results obtained from Model-2 in figure 50 as it predicted 8+2 nominations(2 nominations were book writers), out of which 3 were actually nominated. From the results of Model-1 and Model-2, we predict Richard Linklater to be the winner of Golden Globe 2015 for the Best Screenplay -Motion Picture.