Understanding Traffic Dynamics in Cellular Data Networks and
Applications to Resource Management
Overview
This project seeks to undertake a significant modeling
exercise on wireless/mobile network data with two goals. One goal is ‘intellectual,’
driven towards understanding the traffic dynamics and discovering any possible
structure or relationships. Such understanding will bring new insights that in
turn will help to deploy and manage future generation mobile data networks. The
second goal is ‘utilitarian.’ Here, we want to use the understanding for doing some
form of resource management decisions. We specifically target cellular data
networks.
We are working on two major research tasks:
· Develop
an understanding of the nature of the spatiotemporal traffic dynamics in
cellular data networks by developing models from largescale
measurement data collected directly from operational networks, and using such
models to effectively forecast load. This modeling study uses a broad range of stateoftheart tools from the statistical machine
learning community.
· Using
the forecasted load, design algorithms to exploit various resource management (e.g.,
energy or capacity provisioning) opportunities in the context of cellular
networks. In particular, we are developing algorithms to select base stations
to turnoff and choose assignments of demands to base stations, such that the
total energy cost is minimized, or deprioritizing non-essential traffic to reduce
peak-to-average ratio of the traffic load.
In addition, we are pursuing research in data analytics
driven traffic management, use of machine learning in wireless localization and
datadriven performance analysis of mobile virtual
networks. We are also studying benefits of network functions virtualization in
cellular networks and pricing issues.
People
- Samir R. Das (PI)
- Luis Ortiz (Co-PI)
- Himanshu
Gupta (Co-PI)
- Milind
Buddhikot (PI @ Bell Labs)
- Utpal
Paul (PhD Student, graduated in 2012)
- Giordano
Fusco (PhD Student, graduated in 2013)
- Navid
Azimi (PhD Student, graduated in 2014)
- Ayon
Chakraborty (PhD student)
- Zafar
Qazi (PhD student)
Highlights
Following highlights are based on hourly basestation
loads (airtime) on a nationwide CDMA-based 3G network containing roughly 10,000
BSs and 1 million subscribers using 1 week long data.
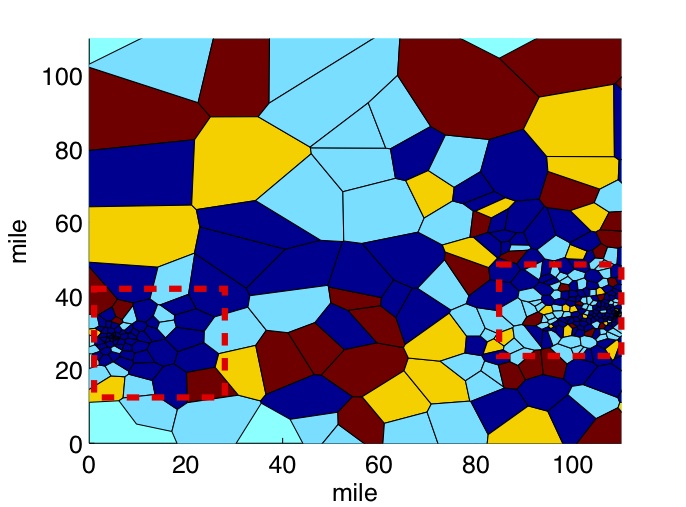
The above shows the optimal spectral clustering of
macro-cells in a subregion based on pairwise
cross-correlation, demonstrating large degrees of correlated behavior.
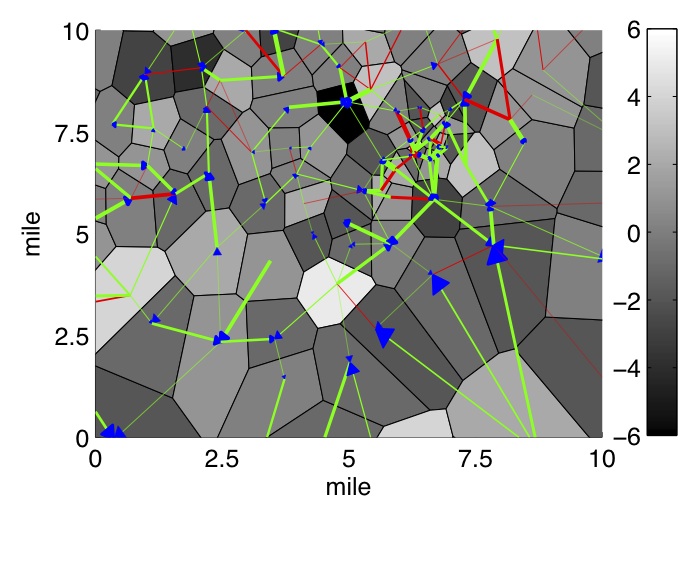
The above shows ‘Granger causal flows’
in a smaller subregion (downtown area) – green
arrows for unidirectional and red lines for bidirectional causality between
neighboring cells, with sequences of arrows and lines showing causal flows.
This demonstrates a significant causal structure.
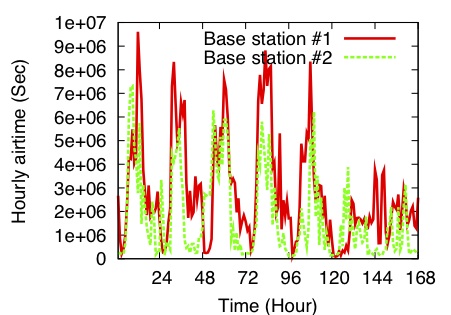
The above shows diurnal variations of the hourly load in the top two BSs in the
seven day period, showing mid-day peaks and lesser
activity in the weekends (the last 2 days).
Relevant Publications
- Fatima Zarinni, Ayon Chakraborty, Vyas Sekar, Samir Das, Phillipa
Gill, “A First Look at Performance in Mobile Virtual Network Operators,”
Proc. ACM Internet Measurement
Conference (IMC), 2014. To appear.
- Zafar
A. Qazi, Vyas Sekar, Samir R. Das, “A Framework to Quantify the Benefits
of Network Functions Virtualization in Cellular Networks,” arXiv Technical Report No. arXiv:1406.5634,
2014.
- Utpal
Paul, Luis Ortiz, Samir.R. Das, Giordano Fusco, Milind M. Buddhikot, “Learning
probabilistic models of cellular network traffic with applications to
resource management,” Proc. IEEE International Symposium on Dynamic
Spectrum Access Networks (DYSPAN), 2014.
- Navid
Hamed Azimi, Himanshu Gupta, Utpal Paul, Milind Madhav Buddhikot, Samir R Das, Minimizing
Capacity Requirements of Cellular Networks via Delayed Scheduling. Proc.
IEEE International Conference on Sensing, Communications and Networking
(SECON), 2013.
- Giordano
Fusco, Navid Hamed Azimi, Himanshu Gupta, “Capacity
Optimization of Femtocell Networks,” Proc. IEEE
International Conference on Sensing, Communications and Networking
(SECON), 2013.
- Utpal
Paul, Milind Buddhikot,
Samir R. Das, "Opportunistic
Traffic Scheduling in Cellular Data Networks,'' Proc. IEEE Symp. on Dynamic Spectrum
Access Networks (DySPAN), Bellevue, WA,
October 2012.
- Utpal
Paul, Aanand Prabhu
Subramanian, Milind Buddhikot,
Samir R. Das, "Understanding
Spatial Relationships in Resource Usage in Cellular Data Networks,'' Proc.
IEEE NetSciCom 2012 Workshop: 4th International
Workshop on Network Science for Communication Networks, Orlando, March
2012.
- Giordano
Fusco, Milind Buddhikot,
Himanshu Gupta, and S. Venkatesan,
"Finding
Green Spots and Turning the Spectrum Novel: Dial Techniques for Green
Mobile Wireless Networks," in Proc. IEEE Symposium on
Dynamic Spectrum Access Networks (DySPAN),
May 2011.
- Utpal
Paul, Anand Prabhu
Subramanian, Milind M. Buddhikot,
Samir R. Das, "Understanding
Traffic Dynamics in Cellular Data Networks", Proc. IEEE
INFOCOM, Shanghai, China, April 2011.
Sponsor
National
Science Foundation
Collaborator