General Info:
Instructor: Prof.
Klaus Mueller
Office hours: Th Th 4-5pm (Live Zoom,
piazza discussion boards)
Phone: 2-1524 (leave message, but better send email)
Office hours:
Location:
email;:
Meeting time and venue:
TuTh 8:00-9:20 pm (Engineering 143)
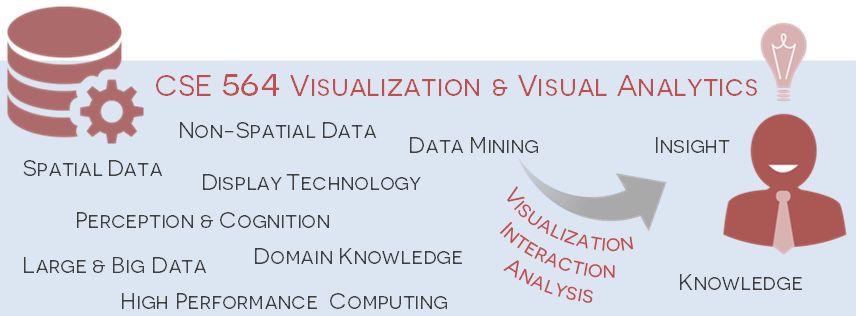
Summary:
Visualization plays an increasingly important
role in the understanding of the massive data that are nowadays being collected
in almost any domain: science, medicine, business, commerce, finance, social
networks, and many more. As such, visualization is often deeply integrated
into the analytics tools developed for data science. This course will discuss
both foundations and applications of this emerging paradigm known as visual
analytics. It will begin with the basics: visual perception, cognition, human-computer
interaction, the sense-making process, data science, computer graphics, and
information visualization. It will then move to discuss how these elementary
constituents are coupled into an effective visual analytics pipeline that allows
humans to interactively reason with data and gain insight. Students will have
the opportunity to hone their skills by a set of projects and then more deeply
explore a topic of their choice by ways of a final programming project. We will
use the public-domain library python for data analytics and the popular javascript
library D3.js for interactive information visualization directly in the web
browser (non-CS students can use the plotly library instead of D3.js). In addition,
students will also gain practical experience with a state of the art volume
renderer for the visualization of medical and scientific data. Check out
this
playlist that has some of the final project videos of the Spring 2026 batch
(here are playlists for
Spring
2025,
Spring
2024,
Spring
2023 Spring
2022,
Spring
2021 and
Spring
2020). This is a 3-credit course.
Outcomes:
By taking this course you will gain:
- An understanding of the role of visual perception, cognition,
and the sensemaking process in human understanding of visual data.
- An ability to apply techniques from AI, data science, machine
learning, computer graphics, and information visualization to construct visual
presentations of data.
- An ability to build visual analytics pipelines that enable humans to interactively reason with data and gain insight.
Prerequisites:
Graduate standing
Working knowledge of Javascript, python
Texts:
Required:
- "Interactive Data Visualization: Foundations, Techniques, and Applications, Second Edition" by M. Ward, G. Grinstein, and D. Keim, 2015
- "Data Mining: The Textbook" by Charu Aggarwal, Springer, 2015.
For additional reference:
- "Visualization Analysis and Design" by Tamara Munzner, AK Peters, 2014.
- "Now You See It: Simple Visualization Techniques for Quantitative Analysis" by Stephen Few, Analytics Press, 2009.
- "Visual Thinking for
Design" by Colin Ware, Morgan-Kaufman, 2008.
- "Data Science for Business: What You Need to Know About Data Mining and Data-Analytic Thinking" by F. Provost and T. Faucett, O'Reilly Media, 2013
- "Visual Computing for Medicine: Theory, Algorithms, and Applications" by Bernhard Preim and Charl Botha, Elsevier, 2013.
- "Computer Graphics: Principles and Practice -
Second Edition in C" by J. D. Foley, A. van Dam, S.K. Feiner, J.F.
Hughes, Addison-Wesley, 1995.
- "Visualization Toolkit" by W. Schroeder, K.
Martin, and W. Lorensen, 2nd ed., Prentice Hall, 1998.
- "Digital Image Processing" by R. Gonzales and R.
Wood, Prentice-Hall, 2002.
- "The Visual Display of Quantitative Information"
by E. Tufte, Graphics Press, 1983.
- "Envisioning Information" by E. Tufte, Graphics
Press, 1990.
- "The Visual Display of Quantitative Information"
by E. Tufte, Graphics Press, 1983.
- "Real Time Volume Graphics
" by K. Engel, M. Hadwiger, J. Kniss, C. Rezk-Salama, and D. Weiskopf, A K Peters, 2006.
Grading:
Projects (3): 10% each
Exams (2): 20% each
Capstone project: 30% (proposal 5%, prelim
report 5%, final report, lighting talk video, live presentation 20%)