Visual
Analytics and Imaging Laboratory (VAI Lab) Computer Science Department, Stony Brook University, NY |
Visual
Analytics and Imaging Laboratory (VAI Lab) Computer Science Department, Stony Brook University, NY |
Abstract: High-dimensional
data visualization has been attracting much attention. To fully test related
software and algorithms, researchers require a diverse pool of data with known
and desired features. Test data do not always provide this, or only partially.
Here we propose the paradigm WYDIWYGS (What You Draw Is What You Get). Its
embodiment, SketchPadND, is a tool that allows users to generate high-dimensional
data in the same interface they also use for visualization. This provides
for an immersive and direct data generation activity, and furthermore it also
enables users to interactively edit and clean existing high-dimensional data
from possible artifacts. SketchPadND offers two visualization paradigms, one
based on parallel coordinates and the other based on a relatively new framework
using an N-D polygon to navigate in high-dimensional space. The first interface
allows users to draw arbitrary profiles of probability density functions along
each dimension axis and sketch shapes for data density and connections between
adjacent dimensions. The second interface embraces the idea of sculpting.
Users can carve data at arbitrary orientations and refine them wherever necessary.
This guarantees that the data generated is truly high-dimensional. We demonstrate
our tool’s usefulness in real data visualization scenarios.
Teaser: Below are the two interfaces:
parallel coordinates and dynamic scatterplots
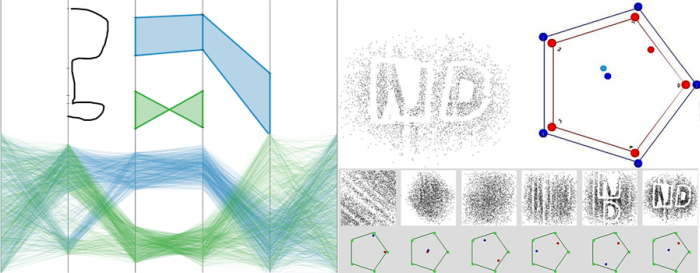
(left) parallel coordinates interface, (right) dynamic scatterplot interface
Video: Watch it to get a quick overview:
Paper: B. Wang, P. Ruchikachorn, K. Mueller, “SketchPadN-D: WYDIWYG Sculpting and Editing in High-Dimensional Space,” IEEE Trans. on Visualization and Computer Graphics, 19(12): 2060-2069, 2013..pdf
Demo: You can play with a partial demo here. It is brower-based -- Chrome and Firefox are reommended.