Visual
Analytics and Imaging Laboratory (VAI Lab) Computer Science Department, Stony Brook University, NY |
Visual
Analytics and Imaging Laboratory (VAI Lab) Computer Science Department, Stony Brook University, NY |
Abstract: Parallel coordinate plots (PCPs) have been widely used for high-dimensional (HD) data storytelling because they allow for presenting a large number of dimensions without distortions. The axes ordering in PCP presents a particular story from the data based
on the user perception of PCP polylines. Existing works focus on directly optimizing for PCP axes ordering based on some common analysis tasks like clustering, neighborhood, and correlation. However, direct optimization for PCP axes based on these common properties is restrictive because it does not account for multiple properties occurring between the axes, and for local properties that occur in small regions in the data. Also, many of these techniques do not support the human-in-the-loop (HIL) paradigm, which is crucial (i) for explainability and (ii) in cases where no single reordering scheme fits the users goals. To alleviate these problems, we present PC-Expo, a real-time visual analytics framework for all-in-one PCP line pattern detection and axes reordering. We studied the connection of line patterns in PCPs with different data analysis tasks and datasets. PC-Expo expands prior work on PCP axes reordering by developing real-time, local detection schemes for the 12 most common analysis tasks (properties). Users can choose the story they want to present with PCPs by optimizing directly over their choice of properties. These properties can be ranked, or combined using individual weights, creating a custom optimization scheme for axes reordering. Users can control the granularity at which they want to work with their detection scheme in the data, allowing exploration of local regions. PC-Expo also supports HIL axes reordering via local-property visualization, which shows the regions of granular activity for every axis pair. Local-property visualization is helpful for PCP axes reordering based on multiple properties, when no single reordering scheme fits the user goals. A comprehensive evaluation was done with real users and diverse datasets confirm the efficacy of PC-Expo in data storytelling with PCPs.
Teaser: The below shows PC-Expo's real-time all-in-one Parallel Coordinate Plot (PCP) axes reordering framework:
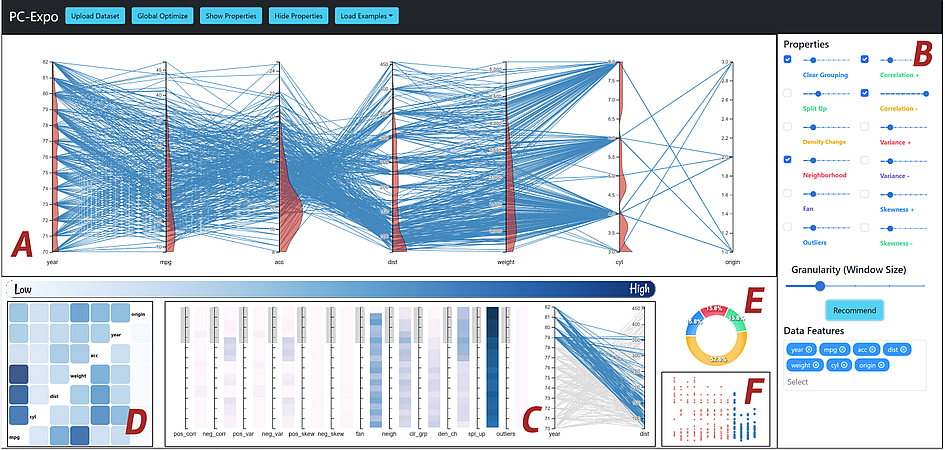
PC-Expo detects local properties in high-dimensional data that can be used to reorder the PCP axes automatically or with human-in-the-loop (HIL) interactions (A). We have implemented detectors for the 12 most common data properties used to reorder PCPs, shown on the properties panel (B). Users can create their own optimization scheme using a weighted sum of these properties, by selecting respective properties and weights from (B), summarized as a donut chart (E) for automated axes reordering. PC-Expo also supports HIL axes reordering via a heatmap and local views (D), (C), and (F). (D) summarizes the weighted sum of user-selected properties detected locally for each axis pair. (C) shows where these visualization properties were detected for a particular axis pair, with a linked scatterplot (F) for visualizing the 2D data points. Users can manually reorder the axes using these local views by clicking on (D) sequentially. The granularity slider in (B) lets users control the size of local regions used to detect the properties. Area charts next to PCP axes in (A) show the local regions where the properties selected on (B) are detected on the axis.
Video: Watch it to get a quick overview:
Paper: A. Tyagi, T. Estro, G. Kuenning, E. Zadok, K. Mueller, "PC-Expo: A Metrics-Based Interactive Axes Reordering Method for Parallel Coordinate Displays," IEEE Trans. on Visualization and Computer Graphics, 29(1):712-722, 2023 PDF | GITHUB