Visual
Analytics and Imaging Laboratory (VAI Lab) Computer Science Department, Stony Brook University, NY |
Visual
Analytics and Imaging Laboratory (VAI Lab) Computer Science Department, Stony Brook University, NY |
Abstract:Deriving the exact casual model that governs the relations between variables in a multidimensional dataset is difficult in practice. It is because causal inference algorithms by themselves typically cannot encode an adequate amount of domain knowledge to break all ties. Visual analytic approaches are considered a feasible alternative to fully automated methods. However, their application in real-world scenarios can be tedious. This paper focuses on these practical aspects of visual causality analysis. The most imperative of these aspects is posed by Simpson Paradox. It implies the existence of multiple causal models differing in both structure and parameter depending on how the data is subdivided. We propose a comprehensive interface that engages human experts in identifying these subdivisions and allowing them to establish the corresponding causal models via a rich set of interactive facilities. Other features of our interface include: (1) a new causal network visualization that emphasizes the flow of causal dependencies, (2) a model scoring mechanism with visual hints for interactive model refinement, and (3) flexible approaches for handling heterogeneous data. Various real-world data examples are given.
Teaser: An actual use case: the causal model of a sales camapign dataset
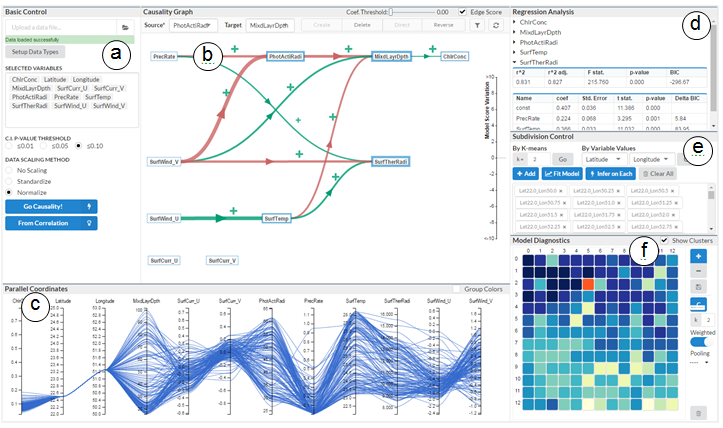
The Causal Structure Investigator interface (a) Control panel for reading in data and setting inference parameters. (b) Interactive path diagrams for causal network visualization. (c) Parallel coordinates view for exploring data partitions. (d) Statistic coefficients tables of regressions associated with the causal model. (e) Data subdivision control, where a subdivision can be saved as a clickable tag. (f) Model diagnostic controls and the model heatmap, where user can examine learned models by clicking each tile colored by model scores.
Video: Watch it to get a quick overview:
Paper: J. Wang, K. Mueller, Visual Causality Analysis Made Practical, (to appear) IEEE Visual Analytics Science and Technology (VAST), Phoenix, AZ, Ocober 2017.pdf ppt