Visual
Analytics and Imaging Laboratory (VAI Lab) Computer Science Department, Stony Brook University, NY |
Visual
Analytics and Imaging Laboratory (VAI Lab) Computer Science Department, Stony Brook University, NY |
This material is based upon work supported
by the US National Science Foundation under Grant
No 1527200
Award ttitle: III: Small: Collaborative Research: ANTE - A Four-Tier
Framework to Boost Visual Literacy for High Dimensional Data
Project director: Dr.
Klaus Mueller, Professor, Computer Science Department, Stony Brook University
The award is in collaboration with project co-director: Dr.Kristina
Striegnitz, Associate Professor, Computer Science Department, Union College
under NSF
Grant No 1527112. Efforts particular to the collaboration are reported on this webpage
The start date of the award was September 1, 2015 and the duration is 3+1 years until August 31, 2019
Project goals:
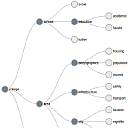
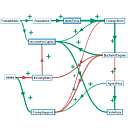
The overall mission of this proposal is to devise new interactive visualization
paradigms to help mainstream users gain insight from complex highdimensional
(ND) data. The tools we propose are formally anchored in a new framework and
methodology we call ANTE. ANTE comprises the following four elements:
- Appeal (to innate visual literacy)
- Narrate (tell stories, explain)
- Transform (into innate visual literacy)
- Engage (attract, involve, interact)
in equal parts to raise the visual literacy of stake holders across the board
– scientists, business people, consumers, etc.
Our work makes ample use of machine learning to derive the visual results.
Papers:
The bekow list are the papers that have been funded by this grant. Many items of this list lead to webpages (indcated by the blue information icons) that offer further detail in form of videos and presentaton files from invited talksgiven at conferences.The remaining items offfer author copies of the assocuated papers that were published.
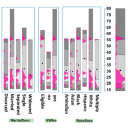
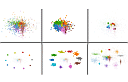
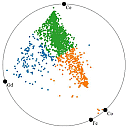
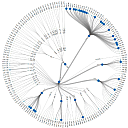
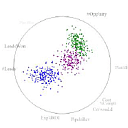
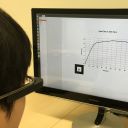
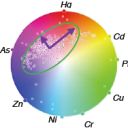
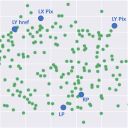
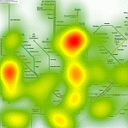
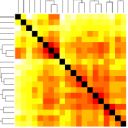
The findings we gained in this grant gave rise to two specific broader impact areas. One deals with the visualization of eye tracking data obtained from eye tracking experiments. The visualization of these data helps researchers and practitioners to gain insight on focus patterns and understanding of imagery observed by the human participating in the experiment.
 |
Task Classification Model for Visual fixation, Exploration, and Search A Kumar, A Tyagi, M Burch, D Weiskopf, K. Mueller Proc. ACM Symposium on Eye Tracking Research (ETRA) Denver, CO, June 2019 |
||
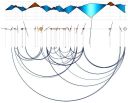 |
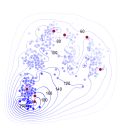
Visually Comparing Eye Movements over Space and Time A Kumar, M Burch, K. Mueller Proc. ACM Symposium on Eye Tracking Research (ETRA) Denver, CO, June 2019 |
||
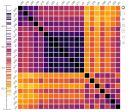 |
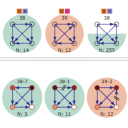
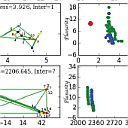
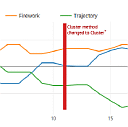
Clustered Eye Movement Similarity Matrices A Kumar, N Timmermans, M Burch, K. Mueller Proc. ACM Symposium on Eye Tracking Research (ETRA) Denver, CO, June 2019 |
||
 |
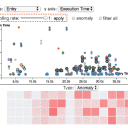
Finding the Outliers in Scanpath Data M Burch, A Kumar, K. Mueller, T. Kervezee, W. Nuijten, R. Oostenbach, L. Peeters, G. Smit Proc. ACM Symposium on Eye Tracking Research (ETRA) Denver, CO, June 2019 |
||
 |
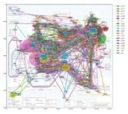
Eye Tracking for Exploring Visual Communication Differences A. Kumar, M. Burch, I. van den Brand, L. Castelijns, F. Ritchi, F. Rooks, H. de Smeth, N. Timmermans, K. Mueller Workshop on Visualization for Communication (co-located with VIS) Berlin, Germany, October 2018 |
||
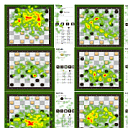 |
Visual Analysis of Eye Gazes to Assist Strategic Planning in Computer Games A Kumar, M Burch,, K. Mueller Workshop on Eye Tracking and Visualization Warsaw, Poland, June 14-17, 2018 |
||
 |
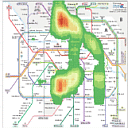
The Hierarchical Flow of Eye Movements M Burch, A Kumar, K. Mueller Workshop on Eye Tracking and Visualization Warsaw, Poland, June 14-17, 2018 |
||
 |
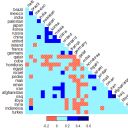
Visual Multi-Metric Grouping of Eye-Tracking Data A. Kumar, R. Netzel, M. Burch, D. Weiskopf, K. Mueller Journal of Eye Movement Research 10 (5), 11-27, 2018 |
||
 |
Color Bands: Visualizing Dynamic Eye Movement Patterns M. Burch, A. Kumar, K. Mueller, D. Weiskopf Workshop on Eye Tracking and Visualization (ETVIS) (held in conjunction with IEEE VIS) Baltimore, MD, 2016 |
||
 |
Multi-Similarity Matrices of Eye Movement Data A. Kumar, R. Netzel, M. Burch, D. Weiskopf, K. Mueller Workshop on Eye Tracking and Visualization (ETVIS) (held in conjunction with IEEE VIS) Baltimore, MD, 2016 |
Another use and application of the developed machine learning tools and visual interfaces has been in the areas of computer vision, image processing, and medical imaging where we have focused on involving human users in tasks related to these areas. The research artifacts emerging from these efforts are listed below.Some of the code was made publicly available on github where indicated.
 |
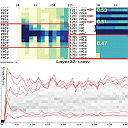
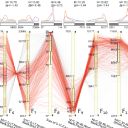
Beyond Saliency: Understanding Convolutional Neural Networks from Saliency Prediction on Layer-Wise Relevance Propagation H. Li, Y. Tian, K. Mueller, X. Chen Image and Vision Computing 83: 70-86, 2019 |
||
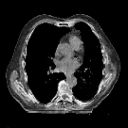 |
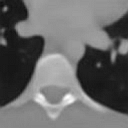
Medical (CT) Image Generation with Style A. Krishna, K. Mueller International Meeting on Fully Three-Dimensional Image Reconstruction (Fully3D) Philadelphia, PA, June 2019 |
||
 |
A GPU-Accelerated Multi-Voxel Update Scheme for Iterative Coordinate Descent (ICD) Optimization in Statistical Iterative CT Reconstruction (SIR) S. Ha, K. Mueller IEEE Transactions on Computational Imaging 4(3): 355-365, 2018 |
||
 |
A Look-Up Table-Based Ray Integration Framework for 2D/3D Forward and Back-projection in X-ray CT S. Ha, K. Mueller IEEE Transactions on Medical Imaging 37(2): 361-371, 2018 |
||
 |
Adaptive Multispectral Demosaicking Based on Frequency Domain Analysis of Spectral Correlations S. Jaiswal, L. Fung, V. Jakhetiya, J. Pang, K. Mueller, O. Au IEEE Transactions on Image Processing 26 (2): 953-968, 2017 |
||
 |
Low-Dose CT Streak Artifacts Removal using Deep Residual Neural Networks H. Li, K. Mueller Fully 3D Image Reconstruction in Radiology and Nuclear Medicine Xi'an, China, June 2017 |
There are several further papers under review at journals and conferences. Once accepted they will be posted and linked to here.
Software sources:
ICE: An Interactive Configuration Explorer for High Dimensional Parameter Space
is available on github here
Beyond Saliency: Understanding Convolutional Neural Networks.. is available on github here
Code of other papers currenlty under review are or will be available in this github repository
Software platforms for use and experimentation:
Visual Causality Analyst: a first prototype is available here
Similar interactive platforms for some of the other tools are currently under development and are expected to be operational soon.
Studies and presentations:
We have recently given a talk at Decision
Camp 2016 entitled "The
Decision Boundary Map: An Interactive Visual Interface to Make Informed Decisions
and Selections in the Presence of Tradeoffs” and we are currently
expanding on this initial effort.
The PI has also recently given an invited talk at Texas A&M Universty (among others) which serves as a good overview of the research outrcomes of this (and other) grants. This talk is available in this downloadable presentation file.
Disclaimer: Any opinions, findings, and conclusions or recommendations expressed in this material are those of the author(s) and do not necessarily reflect the views of the National Science Foundation.
Last update: 12/10/2019